Figures & data
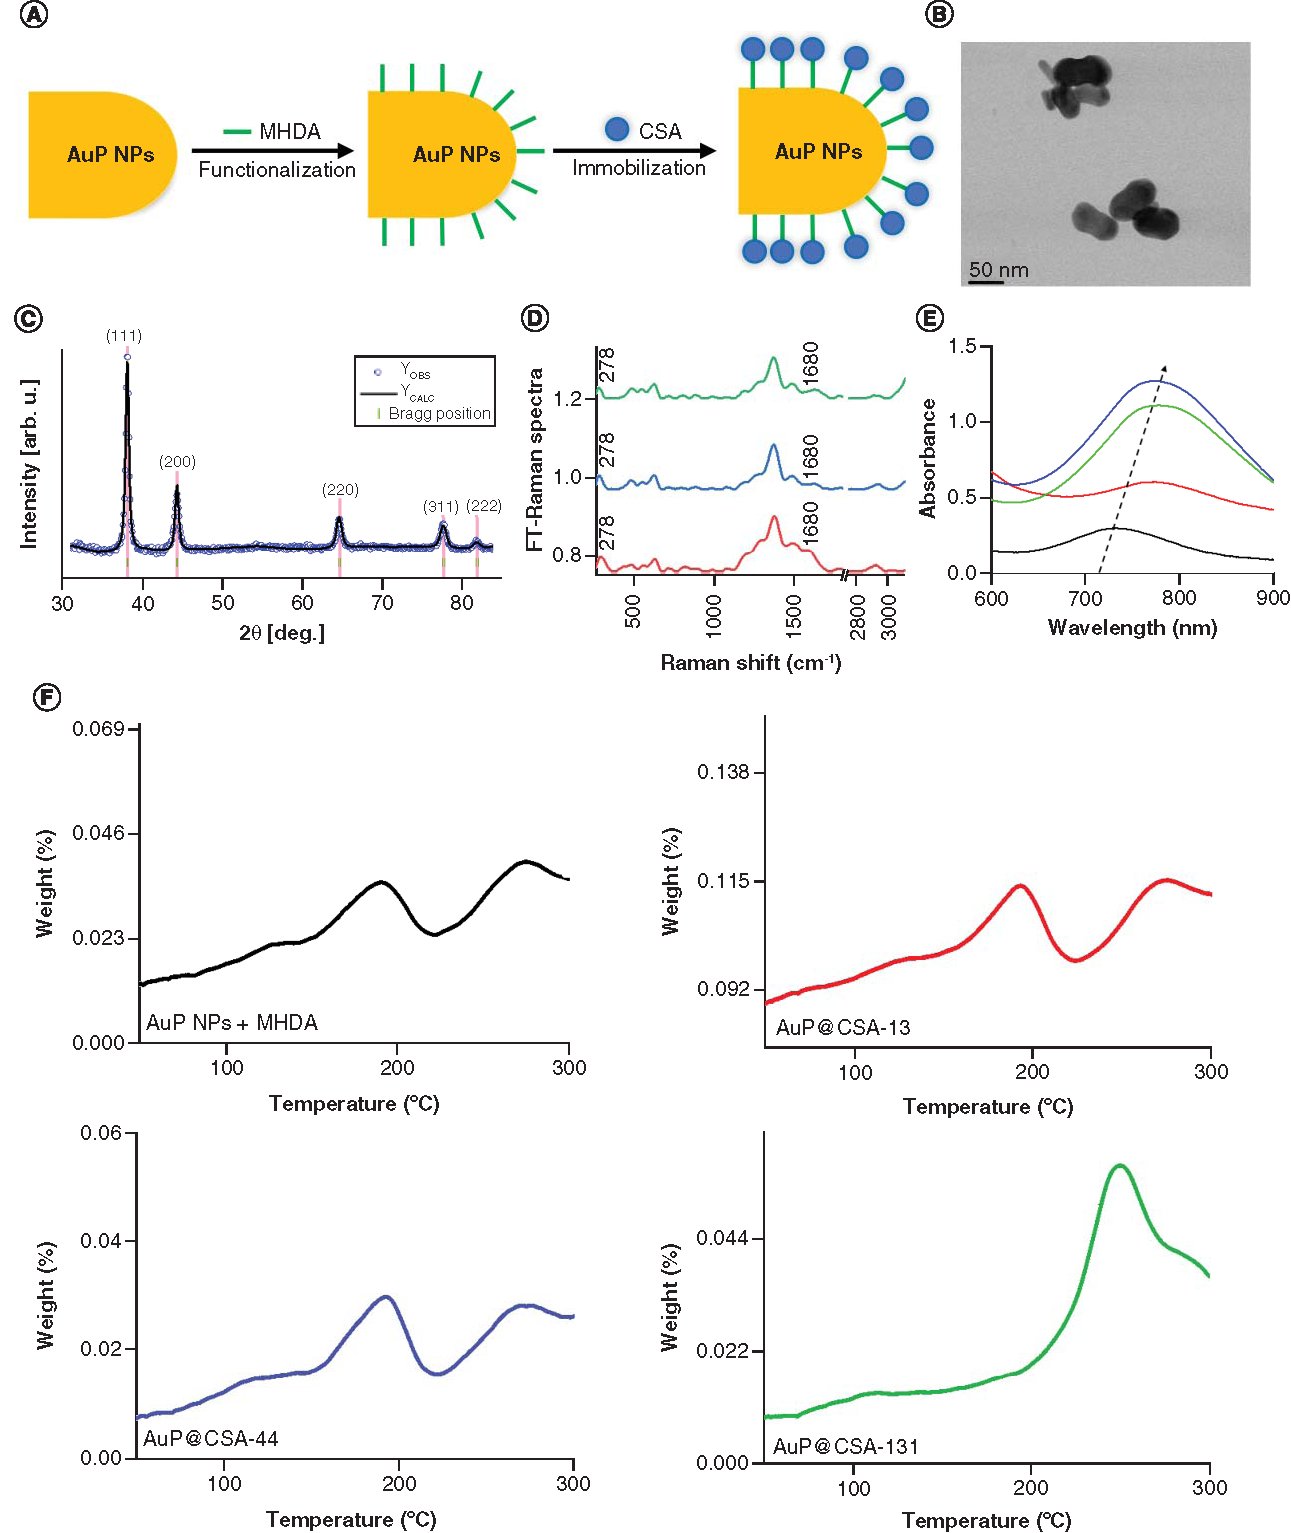
(A) Scheme of the AuP NPs biofunctionalization and ceragenin (CSA) immobilization process. (B) Overview scanning transmission electron microscopy image. (C) X-ray diffraction (XRD) taken for AuP NPs. Experimental (blue dots) and calculated (solid black line) Rietveld refinement plot of the XRD pattern for the AuP NPs. The red line (YOBS–YCALC) represents the difference between the observed and calculated data. Tick marks show allowed Bragg reflections. (D) FT-Raman spectra of nanosystems: AuP NPs + MHDA + CSA-13 (red spectrum); AuP NPs + MHDA + CSA-44 (blue spectrum); AuP NPs + MHDA + CSA-131 (green spectrum). (E) Ultraviolet-Vis spectra of AuP NPs (black spectrum) and AuP NPs + MHDA + CSA-13 (red spectrum); AuP NPs + MHDA + CSA-44 (blue spectrum); AuP NPs + MHDA + CSA-131 (green spectrum). (F) Thermogravimetric analysis and differential scanning calorimetry data of AuP NPs + MHDA and AuP@CSA-13 (red curve), AuP@CSA-44 (blue curve), AuP@CSA-131 (green curve), showing the solvent removal and decomposition of the product.
AuP NP: Gold peanut-shaped nanoparticle; CSA: Cationic steroid antimicrobial; FT: Fourier transform; MHDA: Mercaptohexadecanoic acid.
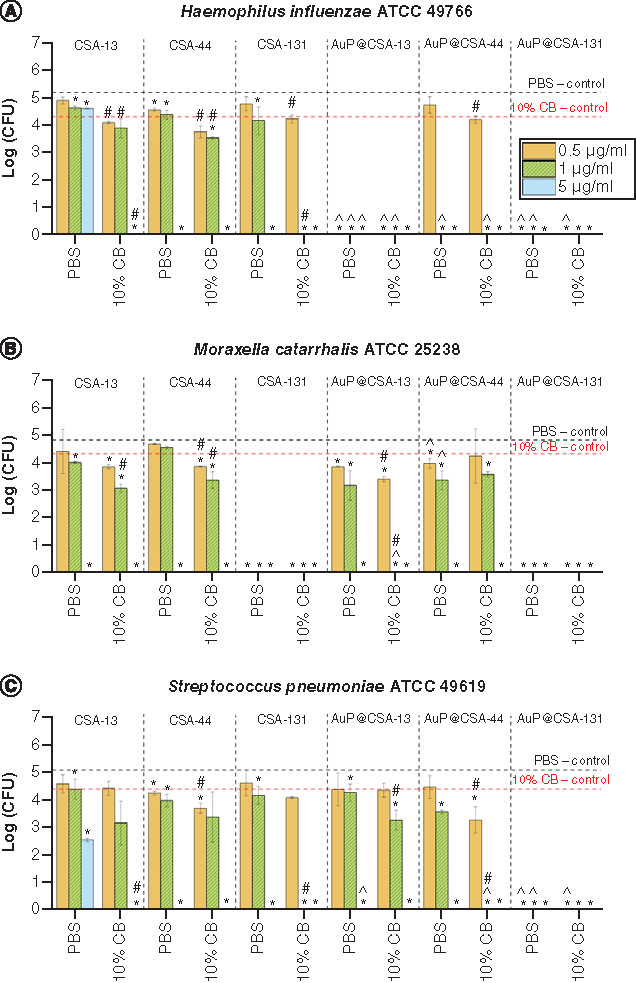
Activity of ceragenins CSA-13 (black squares), CSA-44 (red circles), CSA-131 (blue triangles) and ceragenin-containing nanosystems, AuP@CSA-13 (green squares), AuP@CSA-44 (purples circles) and AuP@CSA-131 (gold triangles) against (A)Haemophillus influenzae ATCC 49766, (B)Moraxella catarrhalis ATCC 25238 and (C)Streptococcus pneumoniae ATCC 49619 strains was evaluated. For each strain, logarithm of number of colonies outgrown [log (CFU)] (panels A1, B1 and C1) and concentration of compound reducing bacteria survival to 2 log (CFU/ml) was calculated (panels A2, B2 and C2). Results are presented as mean ± standard deviation from three replicates.
* and ∧ indicates statistical significance p < 0.05 when compared to untreated control and free ceragenins, respectively. (Where there is more than one *, the values overlap).
ATCC: American Type Culture Collection; AuP: Gold peanut-shaped nanoparticle; CFU: Colony-forming unit; CSA: Cationic steroid antimicrobial.
![Figure 2. Bactericidal activity of tested compounds against otitis media-causing pathogens.Activity of ceragenins CSA-13 (black squares), CSA-44 (red circles), CSA-131 (blue triangles) and ceragenin-containing nanosystems, AuP@CSA-13 (green squares), AuP@CSA-44 (purples circles) and AuP@CSA-131 (gold triangles) against (A)Haemophillus influenzae ATCC 49766, (B)Moraxella catarrhalis ATCC 25238 and (C)Streptococcus pneumoniae ATCC 49619 strains was evaluated. For each strain, logarithm of number of colonies outgrown [log (CFU)] (panels A1, B1 and C1) and concentration of compound reducing bacteria survival to 2 log (CFU/ml) was calculated (panels A2, B2 and C2). Results are presented as mean ± standard deviation from three replicates.* and ∧ indicates statistical significance p < 0.05 when compared to untreated control and free ceragenins, respectively. (Where there is more than one *, the values overlap).ATCC: American Type Culture Collection; AuP: Gold peanut-shaped nanoparticle; CFU: Colony-forming unit; CSA: Cationic steroid antimicrobial.](/cms/asset/3de11caa-cae2-43f5-8d4a-79f94dcd31bf/innm_a_12342005_f0002.jpg)
Table 1. MIC and MBC of ceragenins CSA-13, CSA-44 and CSA-131 in free form and attached to the surface of AuPs against laboratory strains of H. influenzae, M. catarrhalis and S. pneumoniae.
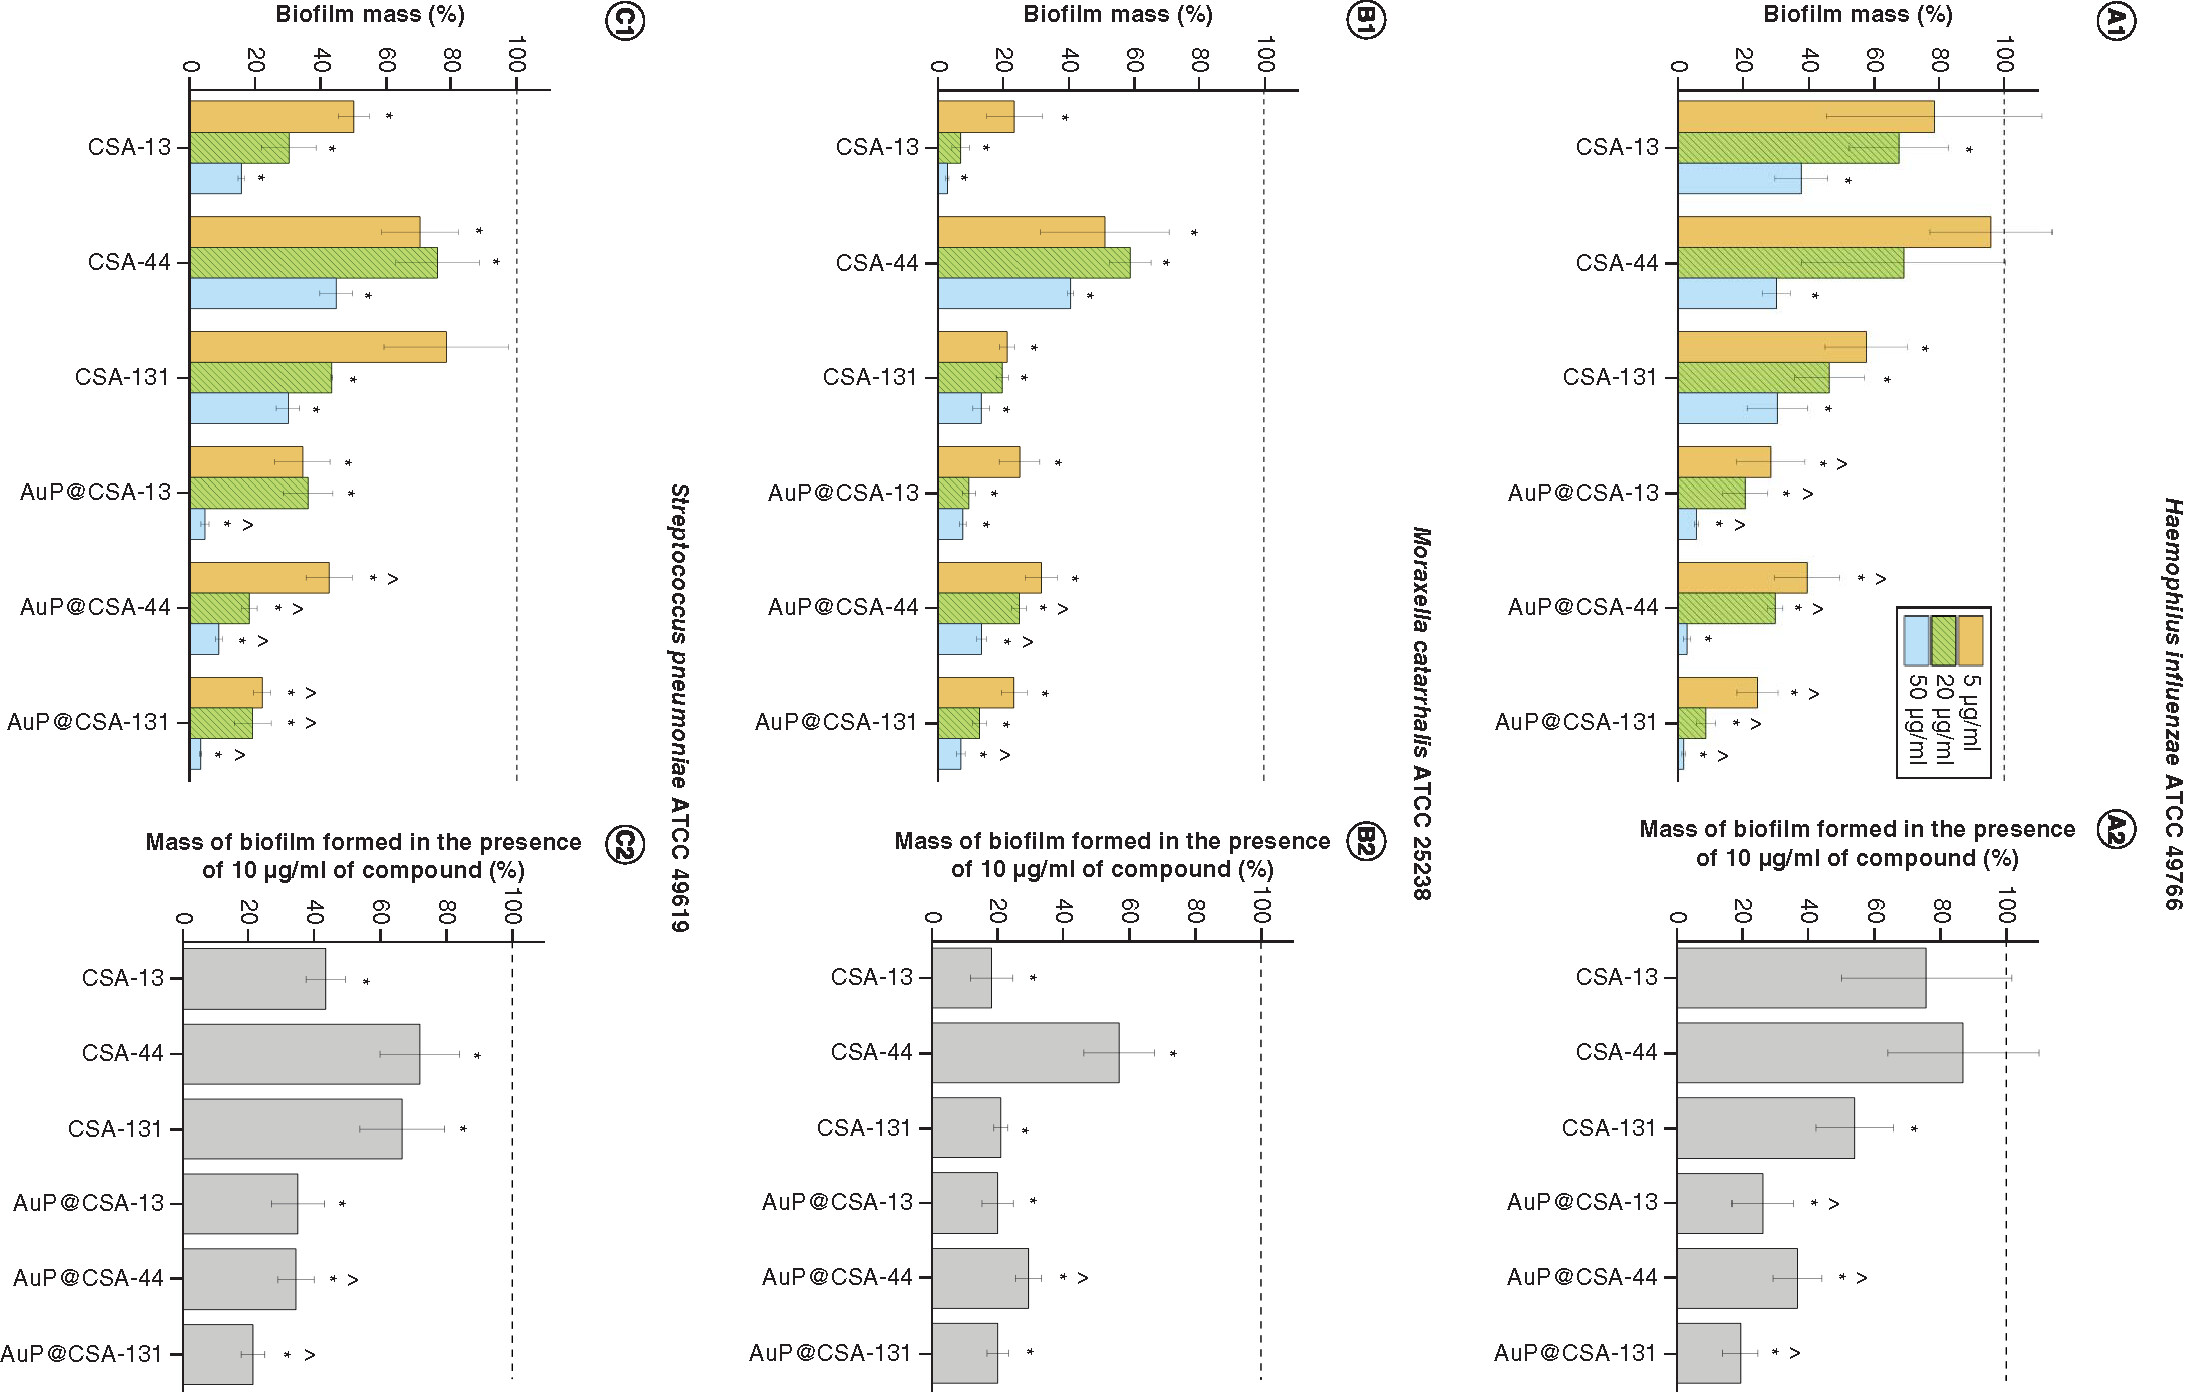
Prevention of biofilm formation by (A)Haemophillus influenzae ATCC 49766, (B)Moraxella cattarhalis ATCC 25238 and (C)Streptococcus pneumoniae ATCC 49619 bacteria treated with ceragenins CSA-13, CSA-44, CSA-131 and CSA-based nanosystems (AuP@CSA-13, AuP@CSA-44, AuP@CSA-131) at concentrations of 5 (gold bars), 20 (green stripped bars) and 50 μg/ml (blue bars) (panels A1, B1 and C1). On the basis of the recorded dose–response curves, mass of biofilm formed in the presence of 10 μg/ml of compound was calculated (panels A2, B2 and C2). Results are presented as mean ± standard deviation from three replicates.
* and ∧ indicate statistical significance (p < 0.05) compared with untreated control and free ceragenins, respectively.
ATCC: American Type Culture Collection; AuP: Gold peanut-shaped nanoparticle; CSA: Cationic steroid antimicrobial.
Activity of ceragenins CSA-13, CSA-44, CSA-131 and ceragenin-containing nanosystems AuP@CSA-13, AuP@CSA-44 and AuP@CSA-131 at doses of 0.5, 1 and 5 μg/ml was tested against (A)Haemophillus influenzae ATCC 49766, (B)Moraxella catarrhalis ATCC 25238 and (C)Streptococcus pneumoniae ATCC 49619. Results are presented as mean ± standard deviation from three replicates.
* and ∧ indicate statistical significance p < 0.05 compared with untreated controls and free ceragenins, respectively.
#indicates statistical significance p < 0.05 compared with viability of bacteria in 10% CB and phosphate-buffered saline.
ATCC: American Type Culture Collection; AuP: Gold peanut-shaped nanoparticle; CB: Cerumen buffer; CSA: Cationic steroid antimicrobial; CFU: Colony-forming unit; PBS: Phosphate-buffered solution.
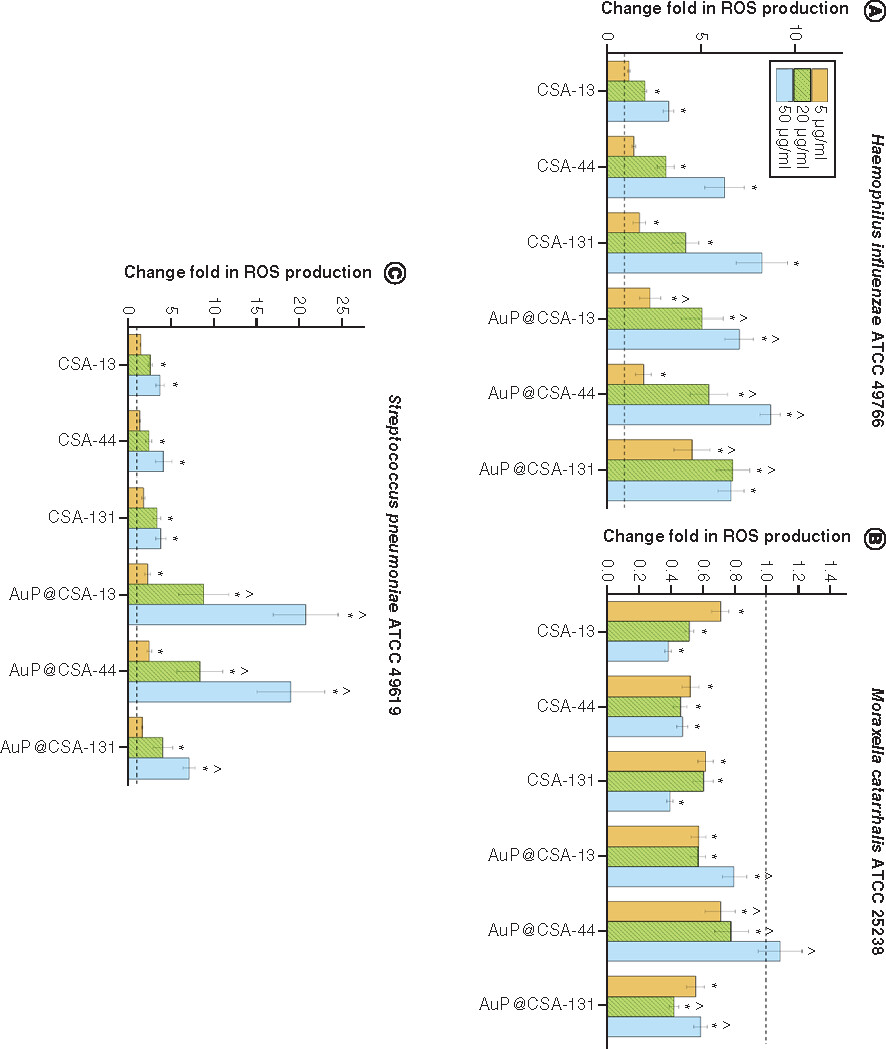
ROS-inducing abilities of ceragenins CSA-13, CSA-44, CSA-131 and ceragenin-containing nanosystems AuP@CSA-13, AuP@CSA-44 and AuP@CSA-44 at a dose of 5 μg/ml (gold bars), 20 μg/ml (green stripped bars) and 50 μg/ml (blue bars) were tested against (A)Haemophillus influenzae ATCC 49766, (B)Moraxella catarrhalis ATCC 25238 and (C)Streptococcus pneumoniae ATCC 49619 (panel C). Results are presented as mean ± standard error of the mean from three to six individual experiments with three replicates each.
* and ∧ indicate statistical significance (p < 0.05) compared with untreated control and free ceragenins, respectively.
ATCC: American Type Culture Collection; AuP: Gold peanut-shaped nanoparticle; CSA: Cationic steroid antimicrobial; ROS: Reactive oxygen species.
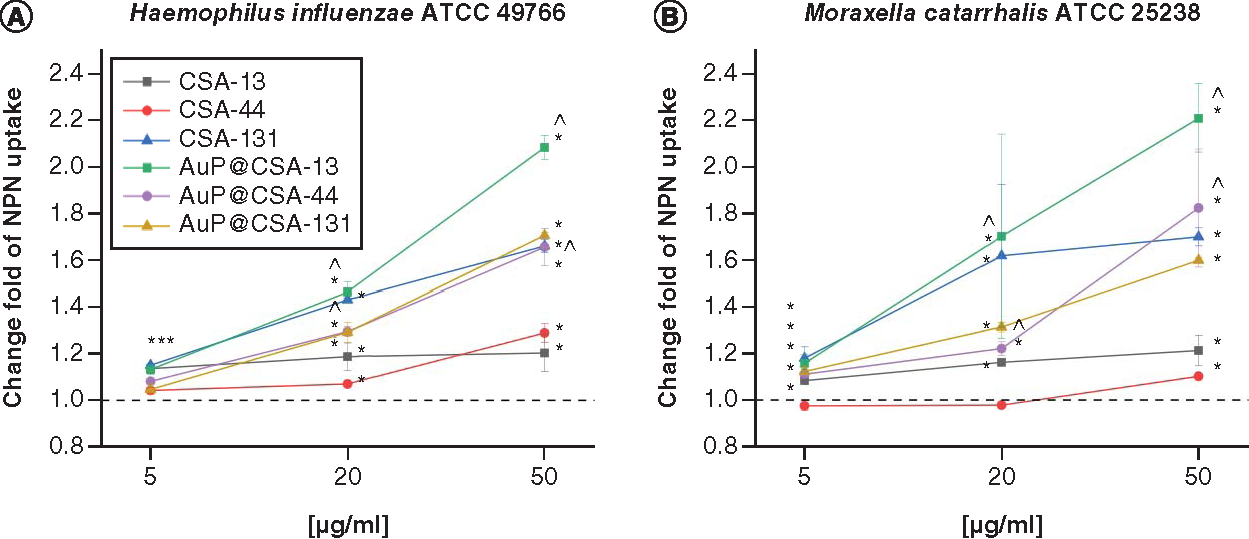
Disruption of bacterial membrane in (A)Haemophillus influenzae ATCC 49766 and (B)Moraxella catarrhalis ATCC 25238 bacteria treated with ceragenins CSA-13, CSA-44, CSA-131 and CSA-based nanosystems (AuP@CSA-13, AuP@CSA-44 and AuP@CSA-131) at concentrations of 5 (gold bars), 20 (green stripped bars) and 50 μg/ml (blue bars). Results are presented as mean ± standard deviation from two individual experiments with three replicates each.
* and ∧ indicate statistical significance p < 0.05 compared with untreated control and free ceragenins, respectively.
ATCC: American Type Culture Collection; AuP: Gold peanut-shaped nanoparticle; CSA: Cationic steroid antimicrobial; NPN: N-phenyl-1-naphthylamine.
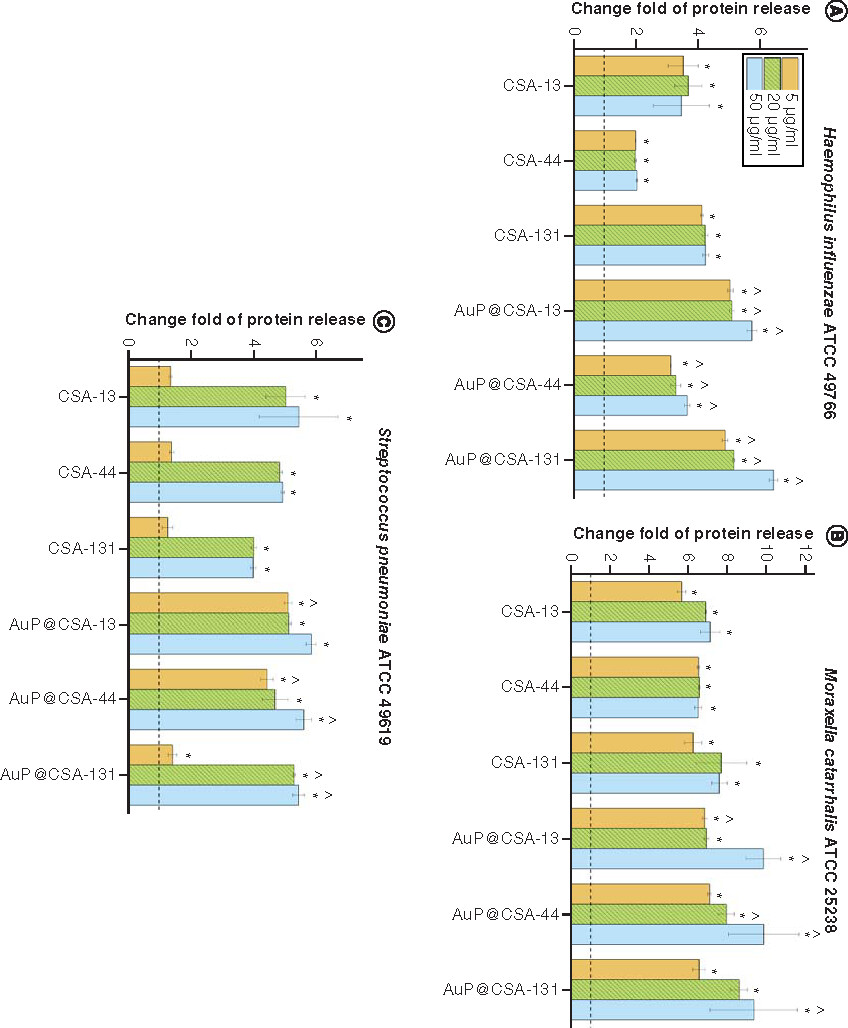
Release of proteins from (A)Haemophillus influenzae ATCC 49766, (B)Moraxella cattarhalis ATCC 25238 and (C)Streptococcus pneumoniae ATCC 49619 bacteria treated with ceragenins CSA-13, CSA-44, CSA-131 and CSA-based nanosystems (AuP@CSA-13, AuP@CSA-44, AuP@CSA-131) at concentrations of 5 (gold bars), 20 (green stripped bars) and 50 μg/ml (blue bars). Results are presented as mean ± standard deviation from three replicates.
* and ∧ indicate statistical significance (p < 0.05) compared with untreated control and free ceragenins, respectively.
ATCC: American Type Culture Collection; AuP: Gold peanut-shaped nanoparticle; CSA: Cationic steroid antimicrobial.
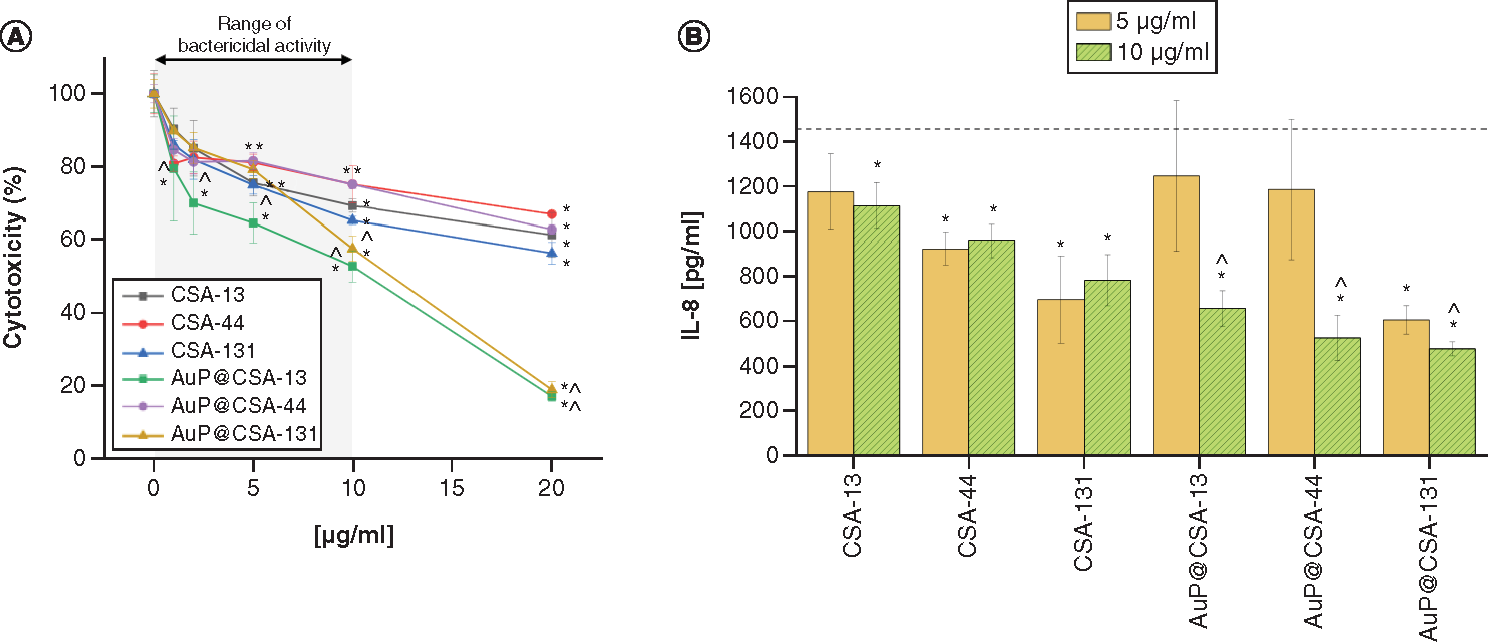
(A) Cytotoxicity of ceragenins CSA-13, CSA-44, CSA-131 and CSA-containing nanosystems AuP@CSA-13, AuP@CSA-44 and AuP@CSA-131 in relations to human keratinocytes (HaCaT) treated with 24 h with tested agents at concentrations ranging from 1 to 20 μg/ml. (B) Decrease of IL-8 release from human keratinocytes stimulated with H. influenzae ATCC 49766 bacteria and treated with tested agents for 24 h. Results are presented as mean ± standard deviation from three replicates.
* and ∧ indicate statistical significance (p < 0.05) compared with untreated control and free ceragenins, respectively. (Where there is more than one *, the values overlap).
AuP: Gold peanut-shaped nanoparticle; CSA: Cationic steroid antimicrobial.