Figures & data
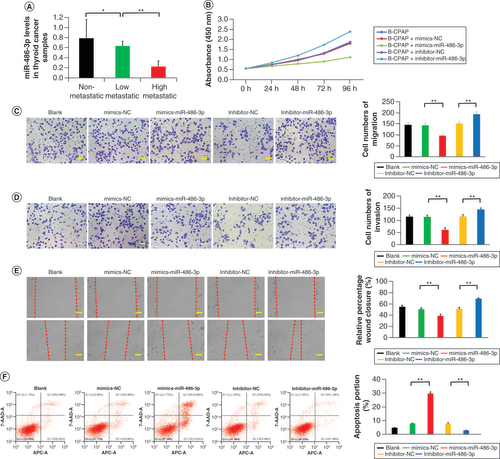
(A) miR-486-3p levels in papillary thyroid carcinoma samples. (B–E) Cell counting kit-8, migration, invasion and scratch experiments of B-CPAP cells intervened with blank, mimics-NC, mimics-miR-486-3p, inhibitor-NC and inhibitor-miR-486-3p. (F) B-CPAP cell apoptosis by flow cytometry in different groups. Scale bars (C & D) = 50 μm. Scale bars (E) = 100 μm. n = 3.
*p < 0.05; **p < 0.01 (one-way analysis of variance).
NC: Negative control.
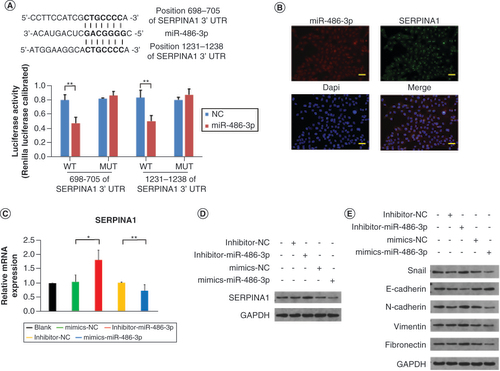
(A) The predicted sequences of the miR-486-3p target sequence in SERPINA1 3′ untranslated regions and luciferase activity detection. (B) RNA fluorescence in situ hybridization experiment results of miR-486-3p and SERPINA1 expression in B-CPAP cells. Scale bars = 100 μm. (C & D) The qRT-PCR and western blot analysis of SERPINA1 expression in B-CPAP cells. (E) Western blot analysis of epithelial–mesenchymal transition protein expression in B-CPAP cells. Scale bars = 100 μm. n = 3.
*p < 0.05; **p < 0.01 (one-way analysis of variance).
NC: Negative control.
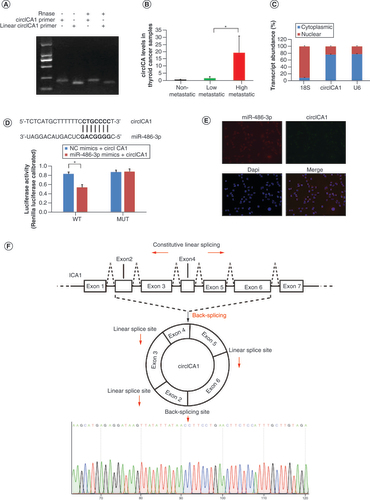
(A) Gel electrophoresis results for circICA1 obtained from full-length cDNA from B-CPAP cells. (B) CircICA1 levels in papillary thyroid carcinoma samples. (C) Nucleocytoplasmic separation experiment results of circICA1 in B-CPAP cells. (D) The predicted sequences of the miR-486-3p target sequence in circICA1 and luciferase activity detection. (E) RNA fluorescence in situ hybridization results of circICA1 and miR-486-3p in B-CPAP cells. Scale bars = 20 μm. n = 3. *p < 0.05; **p < 0.01 (one-way analysis of variance). (F) Schematic illustration showing ICA1 exons 2–6 circularization to form circICA1 (black arrow). The presence of circICA1 was validated by qRT-PCR, followed by Sanger sequencing. Red arrow represents head-to-tail circICA1 splicing sites.
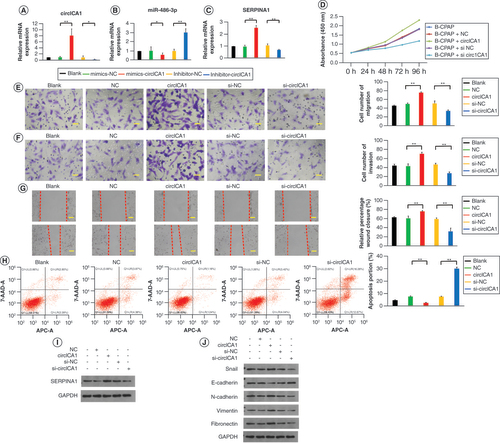
(A–C) qRT-PCR results for circICA1, miR-486-3p and SERPINA1 from B-CPAP cells. (D–G) Cell counting kit-8, migration, invasion and scratch experiments of B-CPAP cells intervened with blank, NC, circICA1, si-NC and si-circICA1. (H) B-CPAP cell apoptosis test by flow cytometry in different groups. (I & J) Western blot analysis of epithelial–mesenchymal transition-related protein expression in B-CPAP cells. Scale bars (E & F) = 50 μm. Scale bars (G) = 100 μm. n = 3.
*p < 0.05; **p < 0.01 (one-way analysis of variance).
NC: Negative control.
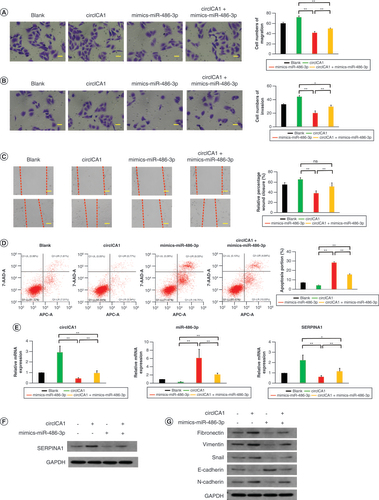
(A–C) Migration, invasion and scratch experiments of B-CPAP cells in different groups. (D) B-CPAP cell apoptosis test by flow cytometry in different groups. (E) qRT-PCR results for circICA1, miR-486-3p and SERPINA1 from B-CPAP cells. (F & G) Western blot analysis of SERPINA1 and EMT protein expression in B-CPAP cells. Scale bars (A & B) = 50 μm. Scale bars (C) = 100 μm. n = 3.
*p < 0.05; **p < 0.01 (one-way analysis of variance).
EMT: Epithelial–mesenchymal transition.
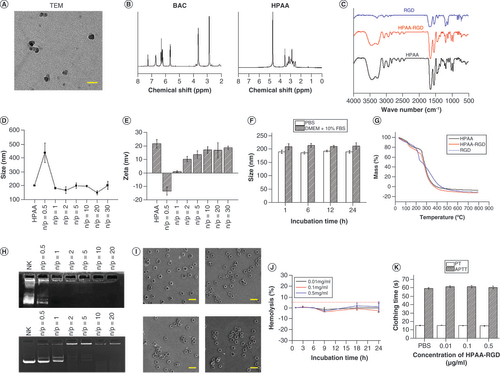
(A) Transmission electron microscopy images of HPAA-RGD. (B & C) The verification of HPAA and HPAA-RGD by (B) nuclear magnetic resonance and (C) infrared spectroscopy. (D & E) The (D) particle size and (E) ζ-potential of HPAA-RGD. (F) The stability of HPAA-RGD pore size in phosphate-buffered saline or Dulbecco’s modified Eagle medium + 10% fetal bovine serum. (G) The thermogravimetry results of HPAA-RGD. (H) Agarose gel electrophoresis results of different proportions of HPAA-RGD. (I) Morphology of red blood cells cultured with HPAA-RGD. (J & K) Hemolysis and coagulation experiments. Scale bars (A) = 100 nm. Scale bars (I) = 20 μm. n = 3.
*p < 0.05; **p < 0.01 (one-way analysis of variance).
APTT: Activated partial thromboplastin time; BAC:N,N’-Bis(acryloyl)cystamine; DMEM: Dulbecco’s Modified Eagle Medium; FBS: Fetal bovine serum; HPAA: Hyperbranched polyamidoamine; NK: Negative control; N/P: The mass ratio between HPAA-RGD and si-circICA1; PBS: Phosphate-buffered saline; PT: Prothrombin time; TEM: Transmission electron microscopy.
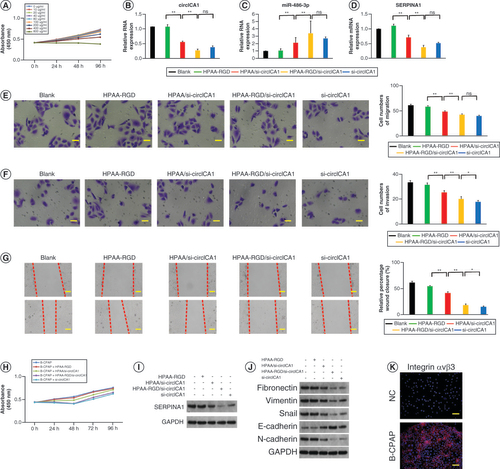
(A) Evaluation of the toxicity of HPAA-RGD/si-circICA1 to B-CPAP cells. (B–D) qRT-PCR results for circICA1, miR-486-3p and SERPINA1 from B-CPAP cells. (E–H) Results of migration, invasion, scratch and cell counting kit-8 experiments of B-CPAP cells in different groups. (I & J) Western blot analysis of SERPINA1 and epithelial–mesenchymal transition-related protein expression in B-CPAP cells. (K) The expression profile of integrin αvβ3. Scale bars (E & F) = 50 μm. Scale bars (G & K) = 100 μm. n = 3.
*p < 0.05; **p < 0.01 (one-way analysis of variance).
HPAA: Hyperbranched polyamidoamine; NC: Negative control; ns: Not significant.
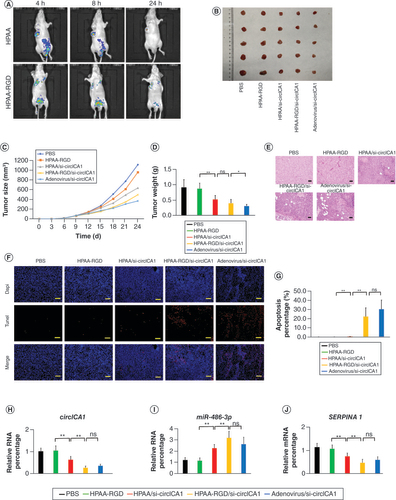
(A) In vivo imaging of nude mice. (B–D) Representative images, volume and weight of the tumors. (E) Hematoxylin and eosin staining of tumor samples. Scale bars = 200 μm. (F & G) Terminal deoxynucleotidyl transferase dUTP nick end labeling staining results of tumor tissues. Scale bars = 200 μm. (H & I) qRT-PCR results for circICA1, miR-486-3p and SERPINA1 from B-CPAP cells. Scale bars = 200 μm. n = 3 or 5.
*p < 0.05; **p < 0.01 (one-way analysis of variance).
HPAA: Hyperbranched polyamidoamine; ns: Not significant; PBS: Phosphate-buffered saline.