
Figures & data
Table 1. Demographic data of included patients (n = 40).
Table 2. Sequences for primer, mimic and siRNAs.
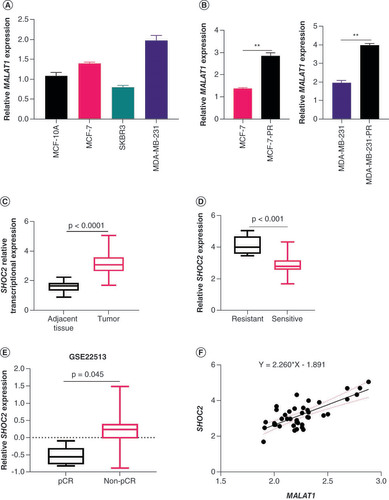
(A) The expression levels of MALAT1 were measured in human mammary epithelial cell line MCF-10A and breast cancer cell lines MCF-7, SKBR3 and MDA-MB-231. (B) The expression of MALAT1 in MCF-7-PR and MDA-MB-231-PR cells was upregulated compared with cells without paclitaxel treatment. (C) The expression of SHOC2 increased in breast cancer tissues compared with adjacent normal tissues. (D) Expression levels of SHOC2 were higher in PR patients compared with paclitaxel-sensitive patients. (E) Expression levels of SHOC2 in the GSE22513 data set. The expression was higher in patients did who not achieve a pathological complete response compared with those who achieved a pathological complete response. (F) The expression of SHOC2 in breast cancer tissue was proportional to MALAT1 expression in collected tissues.
**p < 0.01.
PR: Paclitaxel-resistant.
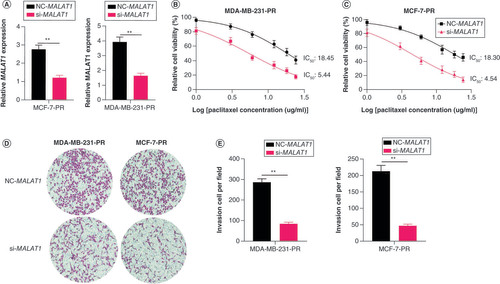
(A) Relative expression of MALAT1 in MCF-7-PR and MDA-MB-231-PR cells after MALAT1 was interfered with si- MALAT1. (B & C) Cell viabilities measured by methyl thiazolyl tetrazolium assay. The survival rate of the si- MALAT1-transfected group was significantly lower than that of the negative control MALAT1 group in (B) MDA-MB-231-PR and (C) MCF-7-PR cells. (D & E) Interfering with MALAT1 expression decreased the invasion ability of MDA-MB-231-PR and MCF-7-PR cells.
**p < 0.01.
PR: Paclitaxel-resistant.
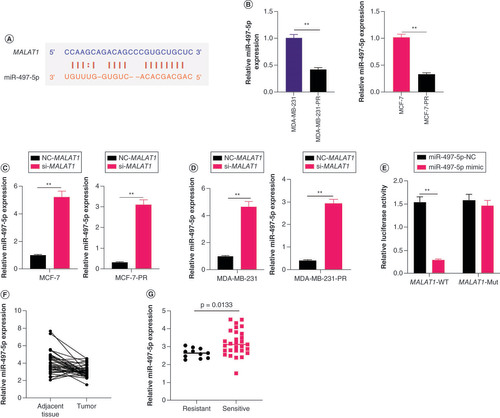
(A) The potential binding site of miR-497-5p with MALAT1. (B) The relative expression of miR-497-5p in breast cancer cell lines MCF-7, MDA-MB-231, MCF-7-PR and MDA-MB-231-PR, measured by qPCR. The PR cells have lower miR-497-5p expression. (C) Relative miR-497-5p expression levels in MCF-7 and MDA-MB-231 cells after MALAT1 was interfered with si- MALAT1. (D) Relative miR-497-5p expression levels in MCF-7-PR and MDA-MB-231-PR cells after MALAT1 was interfered with si- MALAT1. (E) Comparison of the luciferase activity after MALAT1 was cotransfected with the miR-497-5p mimic or negative control miR (miR-497-5p NC) into cells. The luciferase activity of the wild-type MALAT1 sequence was suppressed by the miR-497-5p mimic but the mutant MALAT1 sequence was unaffected. (F) The expression levels of miR-497-5p in breast cancer tissue and adjacent normal tissues. (G) Expression of miR-497-5p was higher in breast cancer tissue than adjacent normal tissues.
**p < 0.01.
PR: Paclitaxel-resistant.
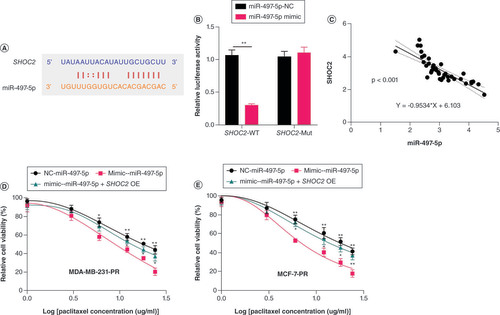
(A) The potential target site for miR-497-5p in SHOC2 as predicted by starBase2. (B) The binding effect of miR-497-5p with SHOC2 verified by luciferase reporter assays. (C) The negative relationship between miR-497-5p and SHOC2 expression levels in breast cancer tissues. (D & E) Overexpression of SHOC2 restored the paclitaxel resistance of (D) MDA-MB-231-PR and (E) MCF-7-PR cells caused by upregulation of miR-497-5p (significance levels are compared with miR-497-5p mimic).
*p < 0.05; **p < 0.01.
PR: Paclitaxel-resistant.
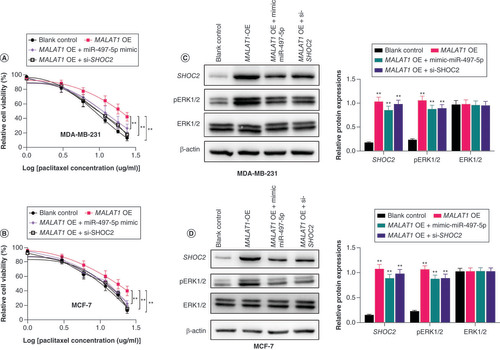
(A & B) Upregulation of MALAT1 in MDA-MB-231 and MCF-7 cells led to increased paclitaxel resistance in both cell lines. Significance levels are relative to MALAT1 overexpression in the same paclitaxel dose. (C) Representative western blot image and column diagram of relative expression of SHOC2, ERK1/2 and pERK1/2 in MDA-MB-231 cells. (D) Representative western blot image and column diagram of relative expression of SHOC2, ERK1/2 and pERK1/2 in MCF-7-PR cells. Significance is relative to the blank control.
*p < 0.05; **p < 0.01.
PR: Paclitaxel-resistant.
Supplemental Figure 1
Download TIFF Image (361.7 KB)Data sharing statement
The data used can be obtained from the corresponding author on reasonable request.