Figures & data
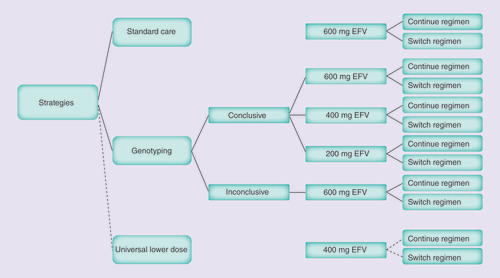
All antiretroviral therapy regimens also include emtricitabine (200 mg) and tenofovir disoproxil fumarate (300 mg).
Conclusive: Genotype result can be interpreted in order to assign a dosing strategy; EFV: Efavirenz; Inconclusive: Genotype result cannot be interpreted (e.g., genotyping fails on the sample).
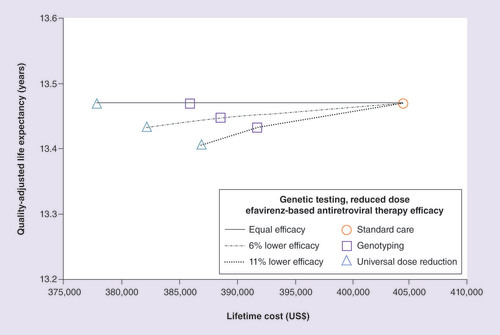
The solid line shows the decrease in total discounted lifetime cost (horizontal axis) with the universal lower dose strategy (triangle) and the genotyping strategy (rectangle) compared with the standard care strategy (circle), assuming equal efficacy among strategies. The difference in quality-adjusted life expectancy among strategies (vertical axis) is minimal. When the efficacy of the lower dose is assumed to be lower compared with 600 mg, the dashed (6% lower) and dotted (11% lower) lines show the lower lifetime cost and quality-adjusted life expectancies for the universal lower dose and genotyping strategies. The cost–effectiveness ratios for these strategies are represented by the slopes of the lines.