Figures & data
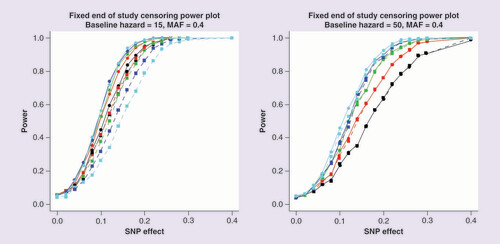
Power is estimated at a 5% significance threshold. Lines with circular points characterize the Cox proportional hazards model and lines with square points the logistic regression model. The color of the line represents the end of study time: 20 days (black); 30 days (red); 40 days (green); 50 days (blue) and 60 days (cyan).
MAF: Minor allele frequency.
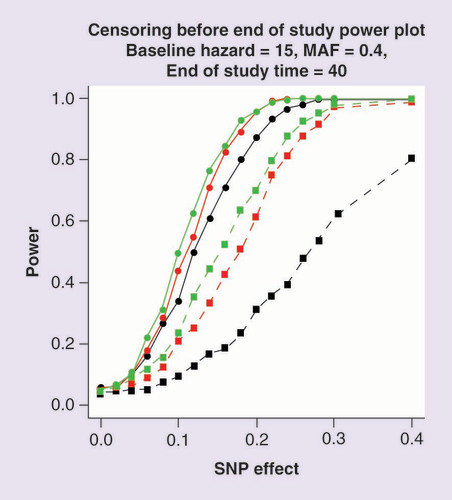
Power is estimated at a 5% significance threshold. Lines with circular points characterize the Cox proportional hazards model and lines with square points the logistic regression model. The color of the line corresponds to the rate of censoring defined by the scale parameter of the Weibull distribution: scale 20 (black); scale 40 (red) and scale 60 (green).
MAF: Minor allele frequency.
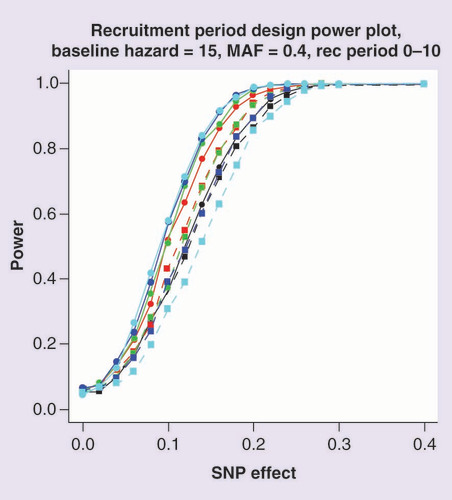
Power is estimated at a 5% significance threshold. The recruitment period is between 0 and 10 days. Lines with circular points characterize the Cox proportional hazards model and lines with square points the logistic regression model. The color of the line represents the end of study time: 20 days (black); 30 days (red); 40 days (green); 50 days (blue) and 60 days (cyan).
MAF: Minor allele frequency.
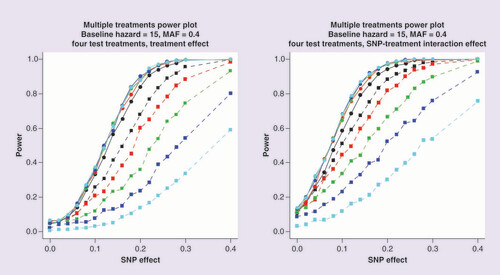
Power is estimated at a 5% significance threshold. Lines with circular points characterize the Cox proportional hazards model and lines with square points the logistic regression model. The color of the line represents the end of study time: 20 days (black); 30 days (red); 40 days (green); 50 days (blue) and 60 days (cyan).
MAF: Minor allele frequency.
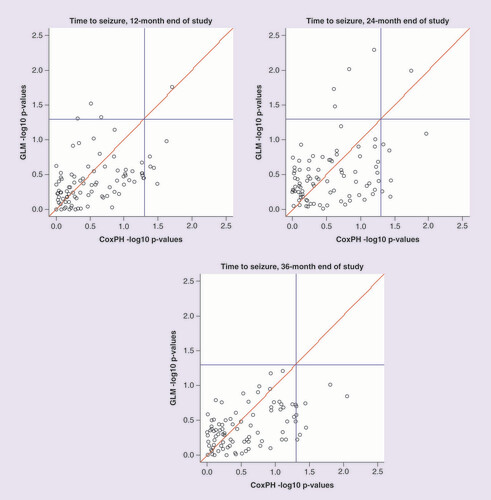
Blue lines represent 0.05 significance levels.