Figures & data
![Figure 1. Ratings of pain relief by subjects indicate that only 7.5% get good pain relief, with 60.4% experiencing less than adequate pain relief.](/cms/asset/3ca2a433-8806-4f27-b795-84dfc9e30cc4/ipmt_a_12344970_f0001.jpg)
![Figure 2. Visual analog scale scores at baseline and after device use shows a mean pain reduction of 39.9% across all the chronic back pain subjects in the study.](/cms/asset/64aad6e0-e895-434e-9508-68e2943029f0/ipmt_a_12344970_f0002.jpg)
![Figure 3. The percent of subjects who made changes in medication use during the 7-day trial: no change (49%), increased (0.6%), decreased (36%), eliminated (14%) and started a new medication (0.3%).](/cms/asset/9db4cfc2-4110-4505-972f-401ff2aa2ee7/ipmt_a_12344970_f0003.jpg)
The mean number of adverse effects was 4.6 per subject.
![Figure 4. Types of adverse effects and the number who reported these effects for the 66% (n = 658) who reported having side effects.The mean number of adverse effects was 4.6 per subject.](/cms/asset/67a80bf7-9ea6-4a59-a17e-12708be79c17/ipmt_a_12344970_f0004.jpg)
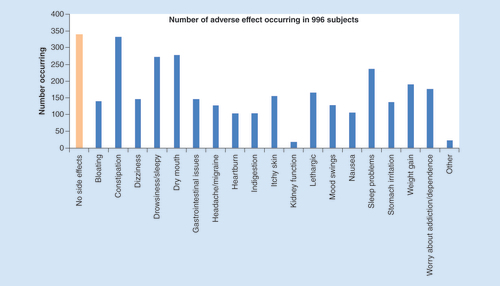
Table 1. Gender distribution.
Table 2. Duration of pain.
Table 3. The reported etiologies show a heterogeneous pain population.
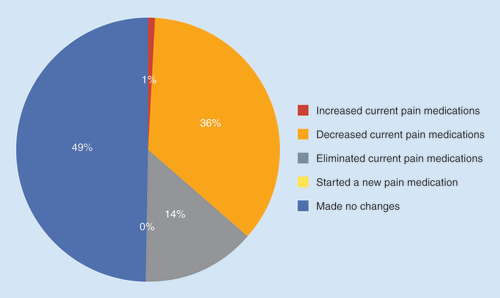
Table 4. Medication use of the subjects in the study.
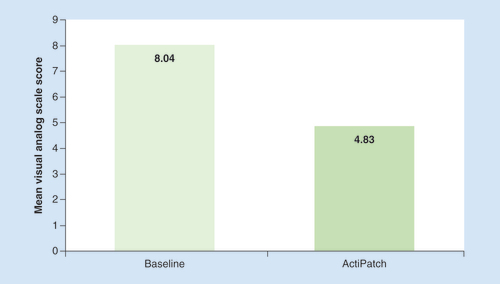
Table 5. The percent of individuals who reported a 40% or greater visual analog scale scores reduction was 726/1394 or 52%.
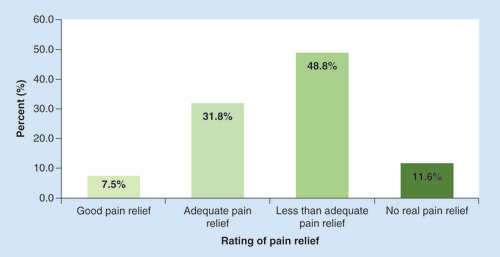
Table 6. The intent to continue therapy.
Table 7. Pain duration, analgesic use, percent subjects reporting adverse effects, mean adverse effects and their impact on patients’ quality of life.
Table 8. Subject age group, analgesic use, percent of subjects reporting adverse effects, mean adverse effects and their impact on patients’ quality of life.
Supplemental material