
Figures & data
Table 1. Baseline demographics and characteristics.
Error bars indicate the positive standard deviation (negative standard deviation not shown).
ER: Extended release; IR: Immediate release.
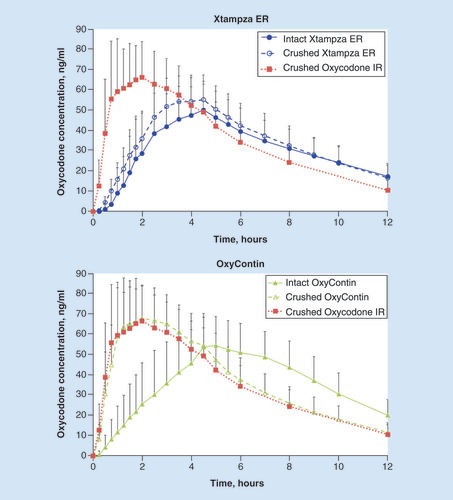
Table 2. Pharmacokinetic parameters.
Table 3. Bioequivalence analysis.
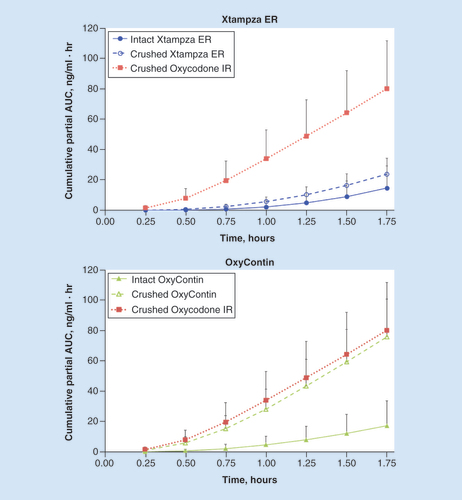
Error bars indicate the positive standard deviation (negative standard deviation not shown).ER: Extended release; IR: Immediate release.
Error bars indicate the positive standard deviation (negative standard deviation not shown).
AQ: Abuse quotient; ER: Extended release; IR: Immediate release.
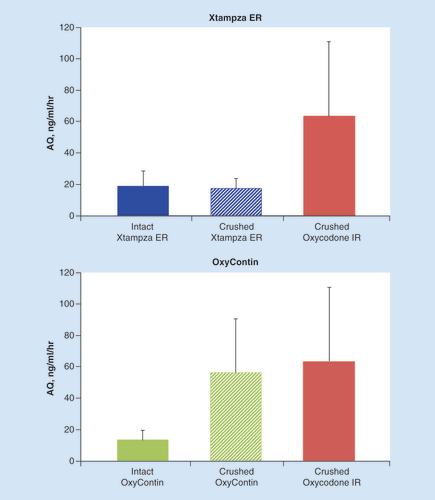
Table 4. Adverse events reported in at least two subjects.
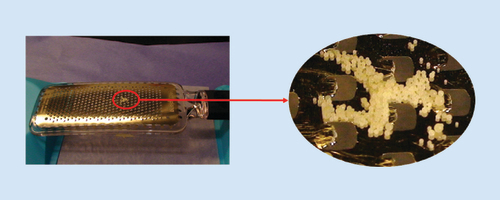
Note the scale of the kitchen grater relative to the microsphere formulation.
ER: Extended release.
Supplemental material