Figures & data
Left panel depicts the assembled ADAM. Right shows a scanning electron micrograph of the zolmitriptan-coated microprojections.
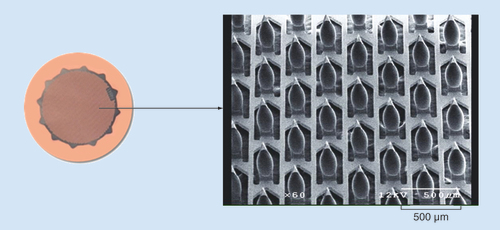
ADAM: Adhesive Dermally-Applied Microarray.
ADAM: Adhesive Dermally-Applied Microarray.
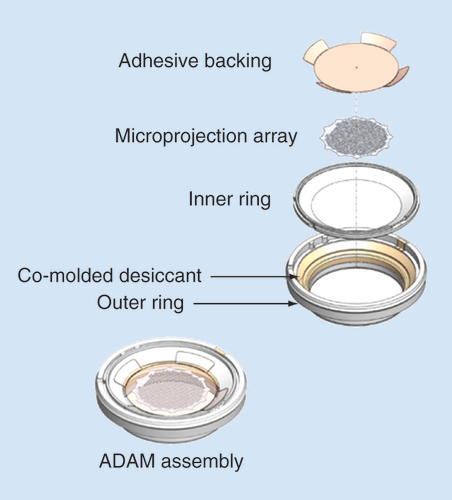
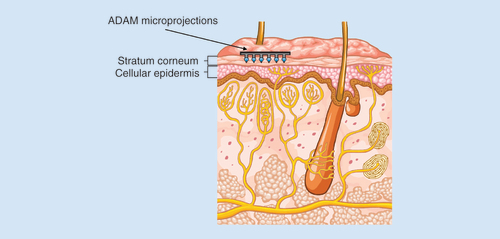

Table 1. Study treatments.
Table 2. Participant demographics and baseline characteristics.
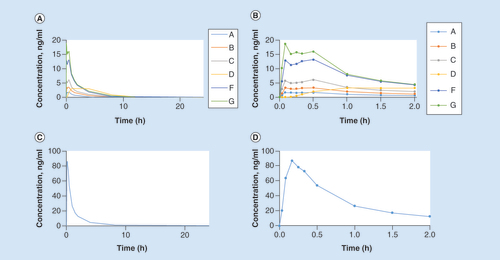
(A) Zolmitriptan groups A, B, C, D, F, G, zero to 24 h (B) Zolmitriptan groups A, B, C, D, F, G, zero to 2 h (C) Sumatriptan group E, zero to 24 h (D) Sumatriptan group E, zero to 2 h.