Figures & data
IPG: Implantable pulse generator.
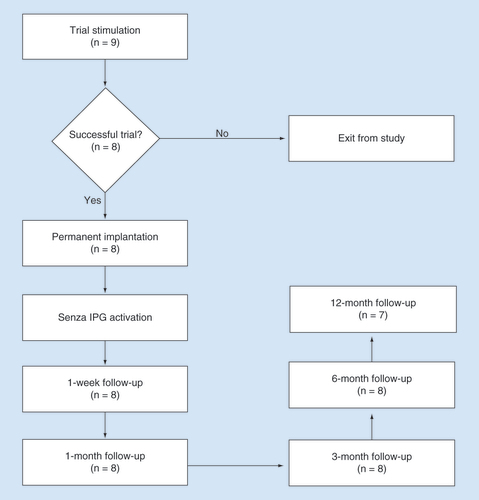
Table 1. Demographic and baseline clinical characteristics of subjects who had trial stimulations.
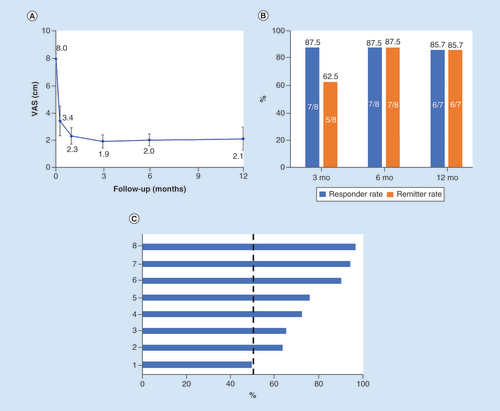
(A) Mean VAS scores are plotted against follow-up time. (B) Responder and remitter rates after 3, 6 and 12 months of stimulation. (C) Percentage pain relief at the 3-month follow-up shows seven of the eight subjects were responders (≥50%).
SCS: Spinal cord stimulation; VAS: Visual analog scale.
(A) The neurological status of all subjects who received permanent implants was either improved or maintained after trial stimulation and after 3 or 12 months of stimulation. (B) The majority of improvements were in sensory and reflex functioning.
EoT: End of treatment.
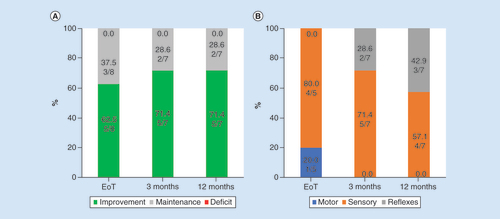
Table 2. Summary of adverse events, their relationship to the study, and severity.
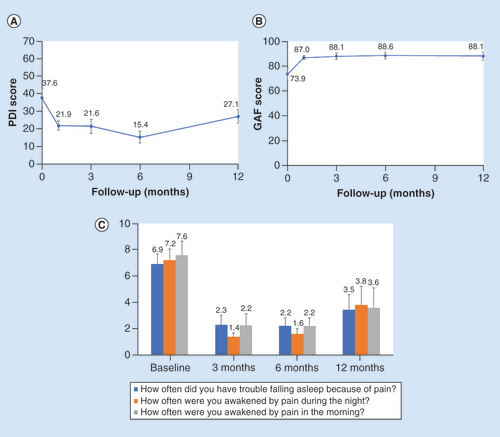
(A) Mean PDI scores decreased from baseline levels within 1 month of stimulation and remained low through the study period. (B) GAF scores increased within 1 month of stimulation and remained elevated through the 12-month follow-up. (C) Mean PSQ-3 sleep scores decreased after the initiation of stimulation.
GAF: Global assessment of functioning; PDI: Pain disability index; PSQ-3: Pain and sleep questionnaire; SCS: Spinal cord stimulation.
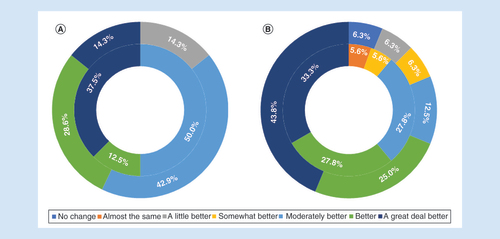
Using the Global Impression of Change, both subjects (A) and clinicians (B) reported improvement in nearly all cases.