
Figures & data
(A) LF thickness (AP) measured perpendicular to the border of the lamina corresponding to the intervertebral disc. (B) MRI cross-sectional image demonstrating LSCS. Arrow demonstrates LFH measurement.
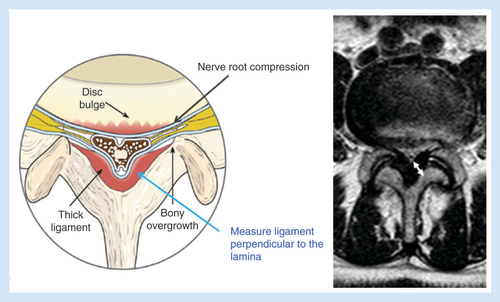
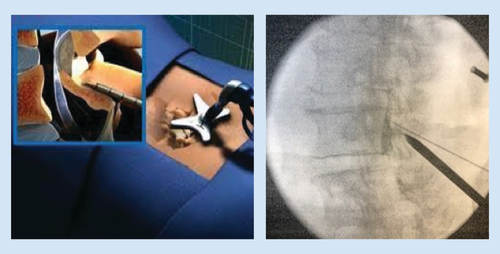
(A) LF thickness (AP) measured perpendicular to the border of the lamina corresponding to the intervertebral disc. (B) MRI cross-sectional image demonstrating LSCS. Arrow demonstrates LFH measurement.