Figures & data
Subjects from the SENZA-ULN and SENZA-UEP studies were selected on the basis of available pain scores and opioid dose information at baseline or after 12 months of stimulation. A total of 41 subjects were included in the current analysis.
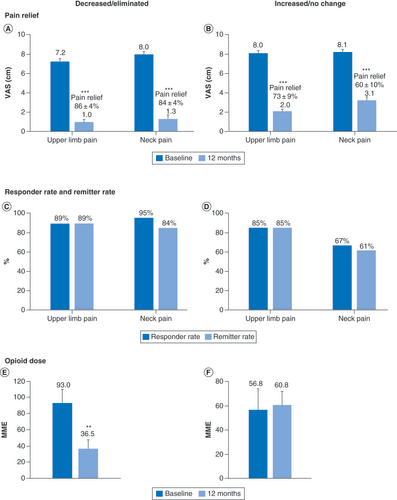
MME: Milligram morphine equivalent; VAS: Visual analog scale.
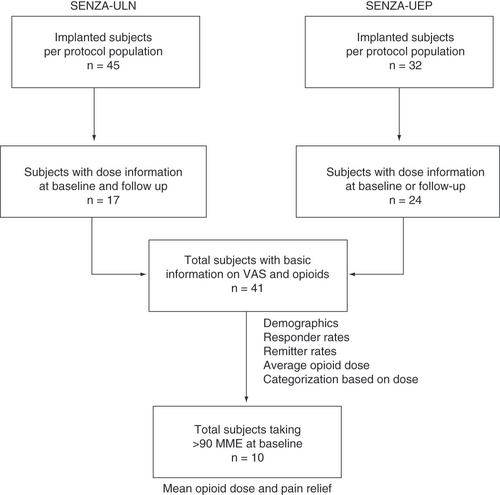
Table 1. Baseline demographics and clinical characteristics of subjects from SENZA-ULN and SENZA-UEP included in the analysis.
**p < 0.01; ***p < 0.001.
MME: Milligram morphine equivalent; VAS: Visual analog scale.
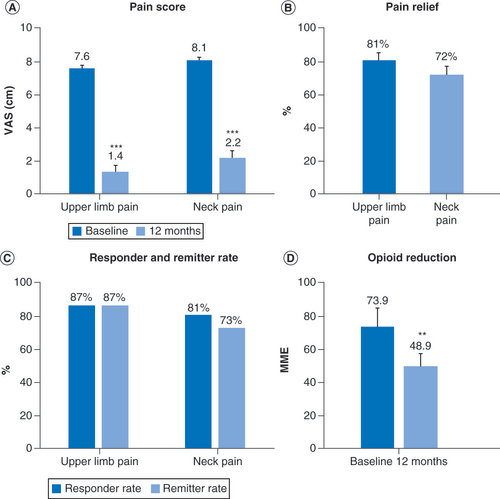
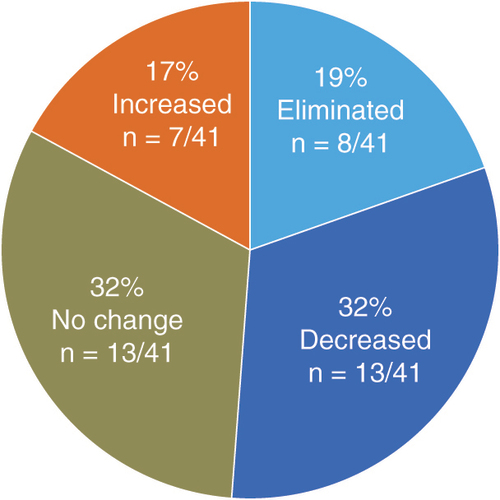
Pain scores (A & B); Response and remission rates (C & D) and mean daily opioid dose at baseline and 12 months in subjects who decreased or eliminated opioid consumption (E) and in subjects who did not change or increased their opioid consumption (F).
**p < 0.01; ***p < 0.001.
MME: Milligram morphine equivalent; VAS: Visual analog scale.
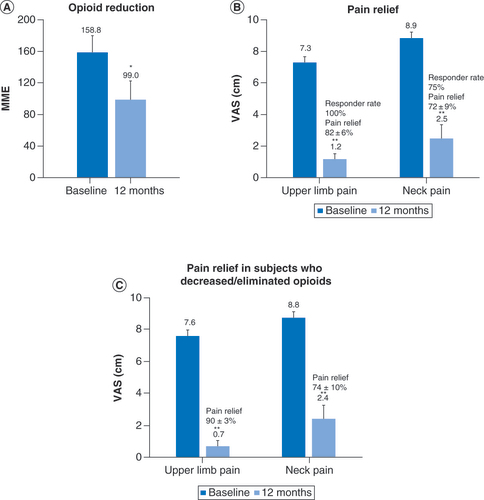
Subjects with baseline opioid doses of more than 90 mg morphine equivalents per day reduced their mean opioid consumption after 12 months of treatment with 10 kHz spinal cord stimulations (A) and their pain scores were also reduced (B). A similar reduction in pain scores was observed in the subset of subjects taking high-dose opioids who decreased or eliminated opioid (C).
*p < 0.05; **p < 0.01.
MME: Milligram morphine equivalent; VAS: Visual analog scale.