
Figures & data
Green indicates scores of 1 or 2, blue for scores of 3–5, and purple for scores of 6 or 7.
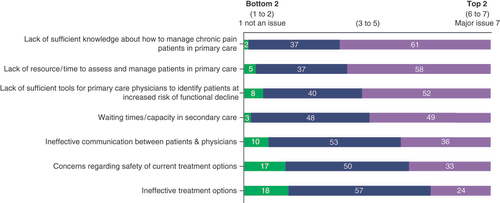
Table 1. Rankings, overall and by region, for responses to question 1: what are the key issues leading to a high proportion of chronic pain patients experiencing functional impairment?
Green indicates scores of 1 or 2, blue for scores of 3–5 and purple for scores of 6 or 7.
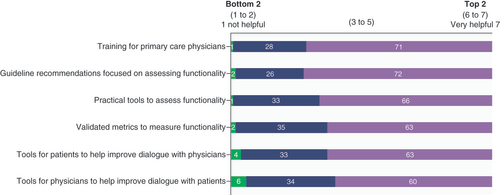
Table 2. Rankings, overall and by region, for responses to question 2: what would help to identify chronic pain patients at increased risk of long-term functional impairment?
Table 3. Responses to question 3: which metrics might provide an early warning sign for patients at increased risk of functional decline?
Supplemental material
Supplemental Document 1
Download MS Word (269.1 KB)Data sharing statement
Data are available on request from Grünenthal. However, all data generated or analyzed during this study are included in this published article/as supplementary information files.