
Figures & data
Table 1. Key inclusion and exclusion criteria.
(A) Octopolar leads were placed based on the location of pain. Lead placements for subjects with lower limb pain are shown on the left, for pain of the trunk in the center and for upper limb pain on the right. (B) Flow chart showing subject progression through the study.
EOT: End of trial; IPG: Implantable pulse generator.
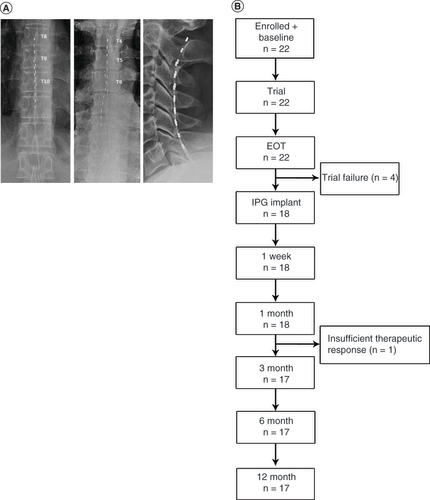
Table 2. Subject demographic information and baseline pain characteristics.
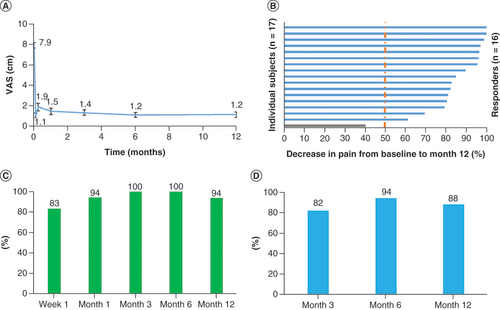
(A) Mean VAS declined immediately upon initiation of trial stimulation and remained low through the end of the study at 12 months. (B) All but one of the subjects were responders, with ≥50% pain relief, after 12 months of stimulation. (C) Responder rates at 3-, 6- and 12-month assessments. (D) Remitter rates (VAS ≤2.5 cm) at 3, 6 and 12 months.
VAS: Visual analog scale.
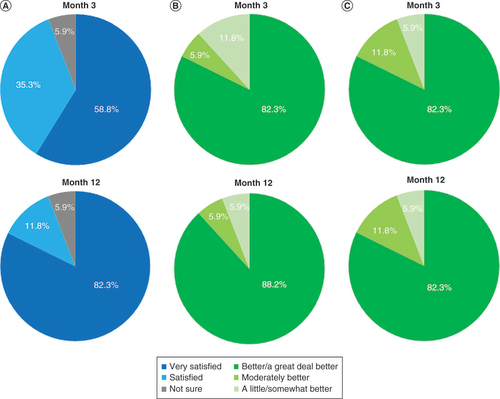
(A) Patient satisfaction shown after 3 and 12 months of stimulation. (B) Responses to the Patient Global Impression of Change questionnaire after 3 and 12 months of stimulation. (C) Responses to the Clinician Global Impression of Change questionnaire after patients had received 3 and 12 months of stimulation.
(A) Pain declined both overall and in all four components of the MPQ-2. (B) Mean scores on the pain catastrophizing scale. (C) Mean responses for the Pain Vigilance and Awareness Questionnaire.
MPQ-2: McGill Pain Questionnaire.
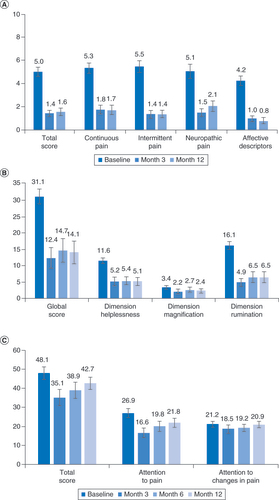
Table 3. Results of assessments for disability, functional capacity, sleep quality and the likelihood of neuropathy.
Table 4. Study-related adverse events.
Data sharing statement
Clinical trial registration number: VT005076953. All the relevant data is included in the publication. Individual data cannot be shared due to privacy concerns.