
Figures & data
ODI: Oswestry Disability Index; VAS: Visual analog scale.
Reproduced with permission, Pain Physician, ASIPP Publishing [Citation19].
![Figure 1. Subgroup analysis for age, sex and levels treated on response measured by visual analog scale and Oswestry Disability Index at 12 months.ODI: Oswestry Disability Index; VAS: Visual analog scale.Reproduced with permission, Pain Physician, ASIPP Publishing [Citation19].](/cms/asset/94979e75-9b52-40e8-991f-cf459e5dd3be/ipmt_a_12344487_f0001.jpg)
Table 1. Baseline demographic and disease characteristics according to age.
Table 2. Mean change in visual analog scale score and Oswestry Disability Index at 12 months according to age.
Data derived from a subpopulation analysis using the modified intent-to-treat population. p-values are derived from the Fisher exact test. Conservative care 12-month crossover visit is used. Month 3 value is used as baseline.
Note: active allograft, n = 55; placebo, n = 17; crossover, n = 7.
ODI: Oswestry Disability Index; VAS: Visual analog scale.
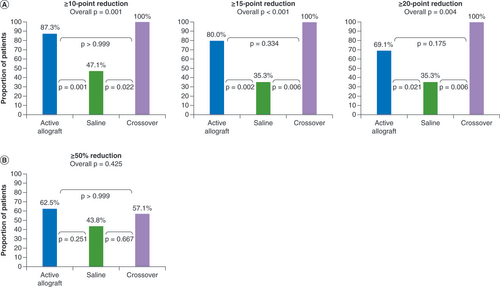
Table 3. Responder analyses at 12 months in patients aged <42 years by number of levels treated.
Data derived from a subpopulation analysis using the modified intent-to-treat population. Conservative care 12-month crossover visit is used with Month 3 value as baseline. The interaction plot illustrates the differences in change from baseline between patients receiving allograft and those who received saline. The plot shows that younger patients (<42 years) showed a benefit that was not observed in older patients (≥42 years) (p = 0.0071; R2 = 0.099). Note: modified intent-to-treat population: active allograft, n = 119; placebo, n = 30; crossover, n = 24.
ODI: Oswestry Disability Index.
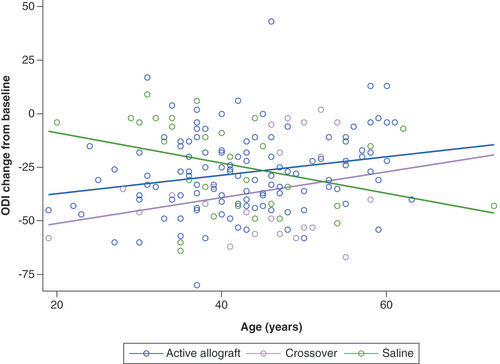
Table 4. Adverse events by age.
Data sharing statement
The authors certify that this manuscript reports the secondary analysis of clinical trial data that have been shared with them, and that the use of this shared data is in accordance with the terms (if any) agreed upon their receipt. The source of this data is: NCT03709901. The datasets generated and/or analysed during the current study are available from the corresponding author on reasonable request.