
Figures & data
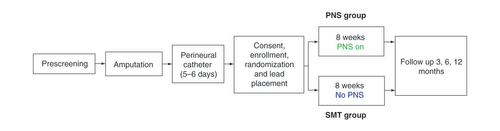
Subjects were consented and enrolled following amputation and randomized to receive a 60-day PNS therapy with SMT or SMT alone. Subjects were followed for up to 12 months.
PNS: Peripheral nerve stimulation; SMT: Standard medical therapy.
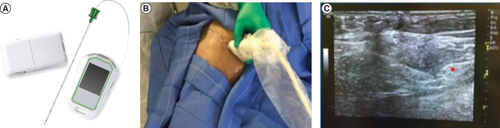
Fine-wire coiled percutaneous leads with an external stimulator and remote (A) were implanted under ultrasound guidance. This example shows a lead placement targeting the femoral nerve (B). After identifying the optimal location using a test stimulation needle, the leads were placed approximately 1–3 cm distant from the femoral and sciatic nerves (C).
Subject flow diagram showing the progression of participants from screening through all study visits. Long-term follow-up is ongoing, and participants still in follow-up are noted as in progress.
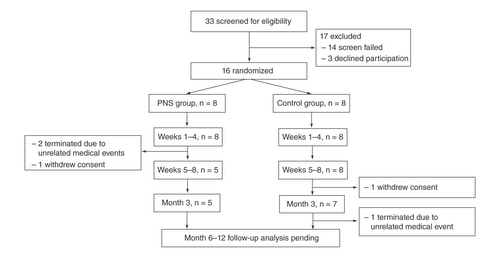
Table 1. Patient demographics.
(A) Group means and (B) percent reduction from baseline for average PLP scores. (C) Group means and (D) percent reduction from baseline for average RLP scores. Data are shown at postoperative baseline and mean of weeks 1–4, weeks 5–8 and at the 3-month follow-up visit. Stimulation was active in the PNS group for 8 weeks beginning after baseline.
PLP: Phantom limb pain; PNS: Peripheral nerve stimulation; RLP: Residual limb pain.
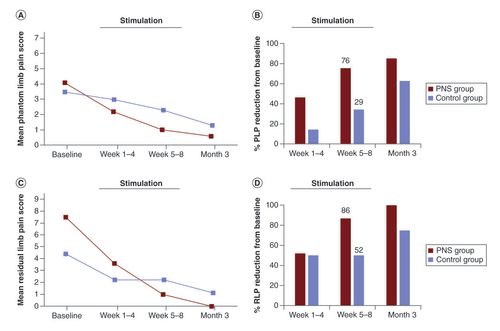
Table 2. Summary of pain scores and percent reduction from baseline over time.
Table 3. Summary of average oral morphine equivalents and % participants taking opioids over time.
(A) The proportion of participants in the PNS group and control group that were taking opioids is shown for the preoperative period, at the time of hospital discharge, during Weeks 1–4, during Weeks 5–8 and at Week 12. The percent reduction in oral morphine equivalents (OME) consumption in the PNS group fell to 69% by the end of the 8-week treatment period, while the control group did not fall that same amount (70%) until Week 12. (B) Average OMEs and (C) percent reduction in average OMEs in the PNS group steadily decreased from the date of hospital discharge to 3 months and fell below preoperative levels by 1–4 weeks. The control group remained higher than preoperative levels throughout the entire 12 weeks. (C) The PNS group saw an earlier rate of decline in the proportion of participants taking opioids and a larger percent reduction of OMEs from baseline over time.
OME: Oral morphine equivalent; PNS: Peripheral nerve stimulation.
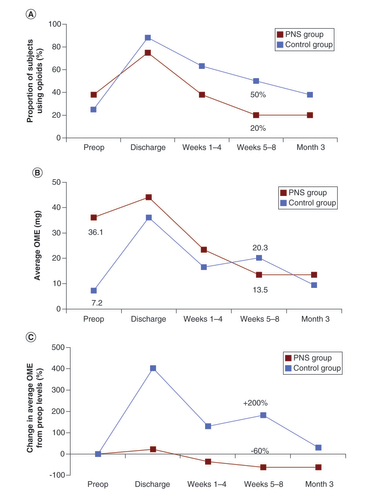
Table 4. Functional independence measure scores over time.
Table 5. Other secondary outcomes over time.
Data sharing statement
The authors certify that this manuscript reports original clinical trial data, NCT03484429. All study data are currently available from ClinicalTrials.gov (https://clinicaltrials.gov/ct2/show/NCT03484429) in accordance with the requirements of the repository.