
Figures & data
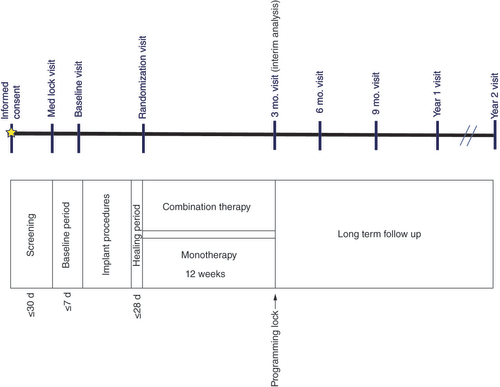
d: Days; Mo.: Month.
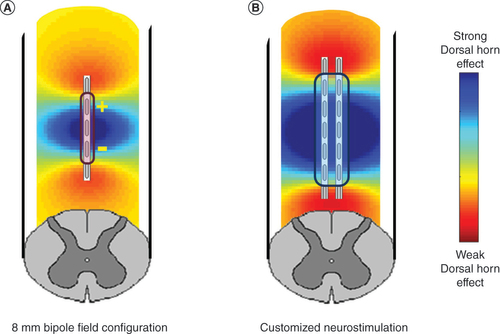
(A) Produced by an 8 mm bipole configuration typical of conventional spinal cord stimulation and (B) algorithmic-based customized spinal cord stimulation configuration designed to more optimally provide for stimulation of the spinal dorsal horn.
A total of 174 subjects were enrolled, of whom 100 were implanted. A prespecified cohort of 89 randomized subjects were included in the interim analysis.
*Pre-specified cohort of 89 randomized subjects for analysis.
SCS: Spinal cord stimulation.
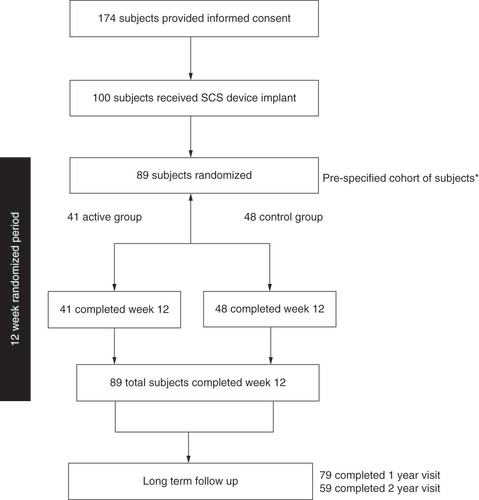
Table 1. Patient baseline characteristics and demographics.
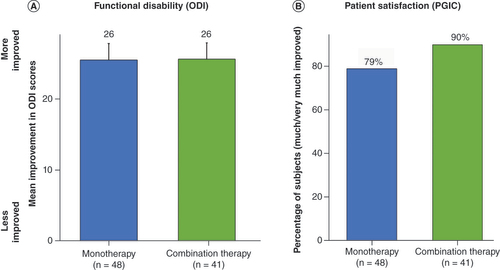
(A) Mean improvement in Oswestry Disability Index score at 3 month follow-up. (B) Proportion of subjects who reported being ‘much’ or ‘very much’ improved at 3 month follow-up.
ODI: Oswestry Disability Index; PGIC: Patient Global Impression of Change.
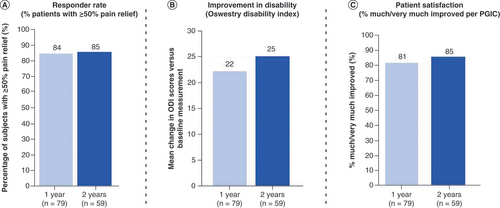
(A) Responder rate. (B) Mean change in ODI scores versus baseline measurement. (C) Percentage of subjects reporting much or very much improved per PGIC.
ODI: Oswestry Disability Index; PGIC: Patient Global Impression of Change.
Data sharing statement
The authors certify that this manuscript reports original clinical trial data of NCT01719055. Individual and deidentified participant data will not be available. The data, analytical methods and study materials for this clinical study will be made available to other researchers in accordance with Boston Scientific’s data sharing policy (https://www.bostonscientific.com).