Figures & data
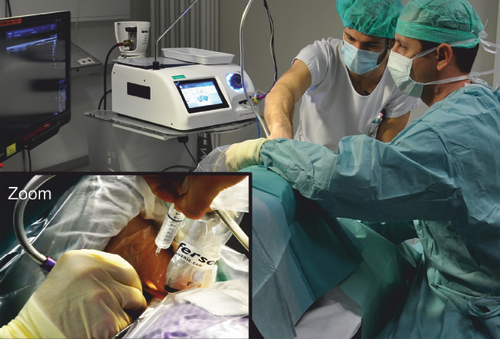
Zoom indicates the sterile surgical field. The cryoprobe is in the right hand of the operator.
An ‘ice ball’ (arrow) is formed at the tip of the cryoprobe in the area of the superficial radial nerve ramus.
A: Radial artery; MBrR: Brachioradialis muscle; N: Superficial radial nerve.
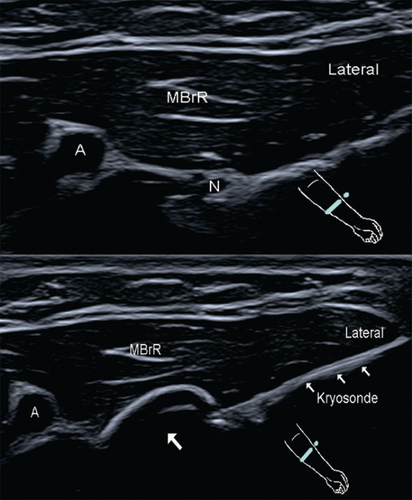
Table 1. Patient baseline characteristics and demographics.
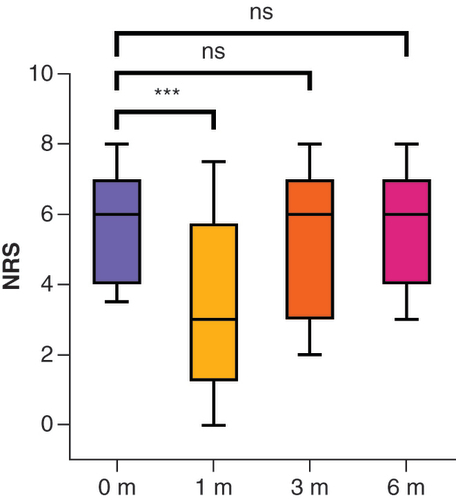
Table 2. Pain level before and after cryoneurolysis during the 6-month observation period.
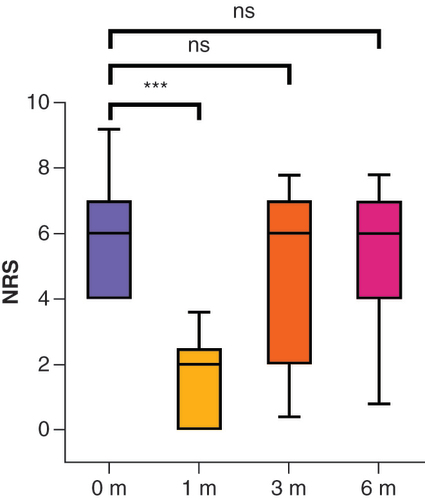
0 m = before, 1 m = after 1 month, 3 m = after 3 months, 6 m = after 6 months. The box and whisker plots show the median, first and third quartiles and 10–90% percentiles. Wilcoxon rank-sum test to compare groups.
***p < 0.001.
m: Months; NRS: Numerical rating scale, ns: Not significant.
0 m = before, 1 m = after 1 month, 3 m = after 3 months, 6 m = after 6 months. The box and whisker plots show the median, first and third quartiles and 10–90% percentiles. Wilcoxon rank-sum test to compare groups.
***p < 0.001.
m: Months; NRS: Numerical rating scale, ns: Not significant.