Figures & data
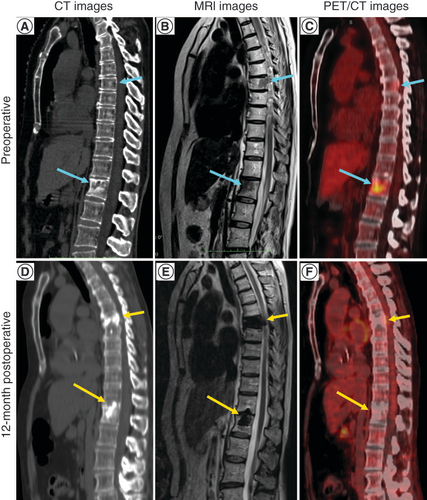
(A) CT image, without contrast, showing bone defects (blue arrows) caused by the metastatic breast tumor. Lysis due to bone destruction and loss is black while sclerotic bone due to pathologic bone formation is white. (B) T2 short tau inversion recovery (STIR) MRI image showing the lytic bone defects (blue arrows) due to the tumor. (C) PET/CT image showing the presence of tumor in the vertebral bodies (red-yellow color; blue arrows). (D) CT image, without contrast, 12 months after treatment. Radio dense bone (yellow arrows) is shown in the space treated using ZetaMet™. (E) T2 STIR MRI image of the treated defects (yellow arrows). Images show that the tumor was replaced with radio dense bone. (F) PET/CT image showing that there is no signal due to tumor in the treated defects (yellow arrows).
CT: Computed tomography.
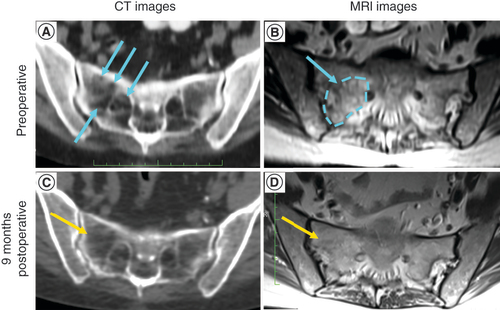
(A) CT imaging showing the defect created by the tumor (blue arrows). The scalloped appearance of bone is associated with bone lysis/destruction adjacent to regions of sclerotic bone. (B) T2 STIR MRI image with gadolinium contrast showing the tumor located in the sacrum defect (blue arrow and dashed line). (C) CT image showing the resolution of the defect (yellow arrow). (D) T2 STIR MRI with gadolinium contrast showing that there is no tumor in the treated defect (yellow arrow). STIR: Short tau inversion recovery.
CT: Computed tomography.