Figures & data
Figure 3: Number of lobster walkout events (bars) on the West Coast and the amounts stranded on a decadal scale. *The 2000s includes data up until March 2008
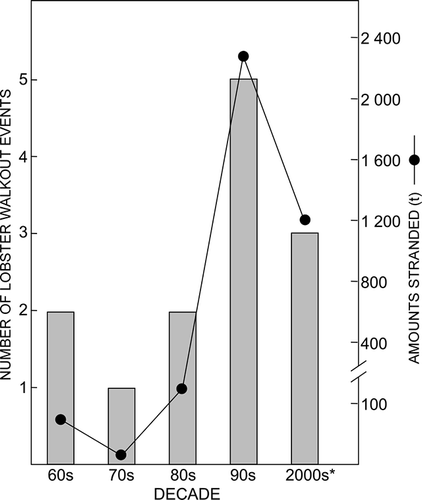
Figure 3: Number of lobster walkout events (bars) on the West Coast and the amounts stranded on a decadal scale. *The 2000s includes data up until March 2008
Please note: Selecting permissions does not provide access to the full text of the article, please see our help page How do I view content?
To request a reprint or corporate permissions for this article, please click on the relevant link below:
Please note: Selecting permissions does not provide access to the full text of the article, please see our help page How do I view content?
Obtain permissions instantly via Rightslink by clicking on the button below:
If you are unable to obtain permissions via Rightslink, please complete and submit this Permissions form. For more information, please visit our Permissions help page.