Figures & data
Table 1 Case study for lecture 5
Table 2 List of sample web-links for lecture 5 (placed on WebCT)
Figure 1 Evaluation Questionnaire
Figure 2 Percentage number of students who identified the individual strategies to be useful or very useful. A) BMS students. B) BS students.
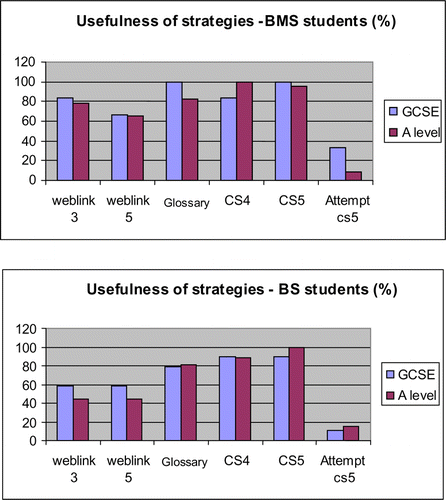
Table 3 Total number of WebCT hits for students from all four courses (n=264)
Table 4 Mean percentage summative test score in the Immunology section (mean +/− SD). Numbers in parentheses indicate total score for the whole module.
Figure 3 Mean percent summative test score for students who accessed, and those who did not access the web-links, for each of the groups tested.
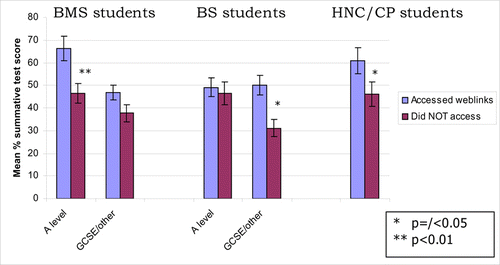
Table 5 Relationship between test scores and A-level grades (Biology and Chemistry)