Figures & data
Figure 1. Inclusion of patients and loss of patients. P-S, project-specific questionnaire; BL, baseline (time of diagnosis); EORTC, includes both QLQ-30 and H&N35. 6 months, 6 months after termination of treatment. *Year 2004 includes only patients treated at the southern RT unit and year 2007 runs only until June 30, since the study was terminated after this.
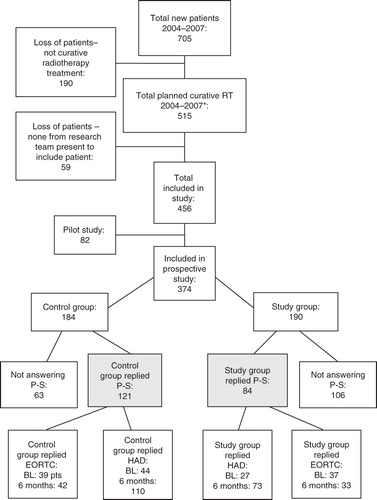
Table I. Patient characteristics.
Table II. Comparison of outcome between study group and control group concerning weight loss and working ability.
Table III. Comparison of outcome between study group and control group concerning self-reported loss of function 6 months after treatment.
Table IV. Comparison between study group and control group concerning global health (EORTC QLQ-30) and depression and anxiety (HAD-S) measured 6 months after treatment.