Figures & data
Table I. Summary of patients' details.
Figure 1. MRI scan for patient no. 17 (definite MD). The endolymphatic hydrops (ELH) is detectable as a black area inside the perilymphatic space filled with the gadodiamide in the left cochlea (a: arrows) and vestibule (b: arrowhead). In the right cochlea, the endolymphatic space (a significantly small area) is not detectable, probably due to strong signal intensity in the perilymphatic space. In the right vestibule, endolympatic space is detectable, but significantly smaller than that found in the left vestibule. [A detailed serial image movie can be seen at: http://www.shinshu-u.ac.jp/faculty/medicine/chair/ent/MRIleft.mov]
![Figure 1. MRI scan for patient no. 17 (definite MD). The endolymphatic hydrops (ELH) is detectable as a black area inside the perilymphatic space filled with the gadodiamide in the left cochlea (a: arrows) and vestibule (b: arrowhead). In the right cochlea, the endolymphatic space (a significantly small area) is not detectable, probably due to strong signal intensity in the perilymphatic space. In the right vestibule, endolympatic space is detectable, but significantly smaller than that found in the left vestibule. [A detailed serial image movie can be seen at: http://www.shinshu-u.ac.jp/faculty/medicine/chair/ent/MRIleft.mov]](/cms/asset/5dabbed6-7fb3-4379-982a-c27877c72526/ioto_a_635383_f0001_b.jpg)
Table II. Results of the glycerol test, ECoG, and 3 T MRI.
Figure 2. Vertical bar chart presentation of the positive rate of each test. *p < 0.05.
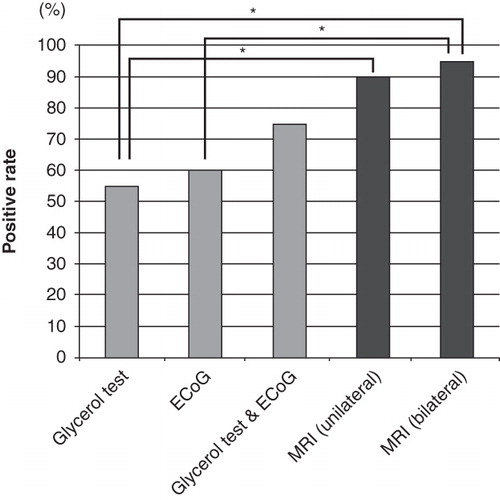
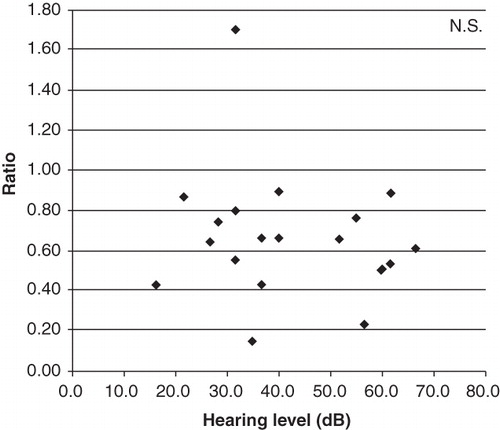
Figure 3. A scatter plot displaying the relationship between the ratio and the hearing level (average of 0.5, 1, and 2 kHz).