Figures & data
Figure 1. Schematic of the experimental set-up. See text for description.
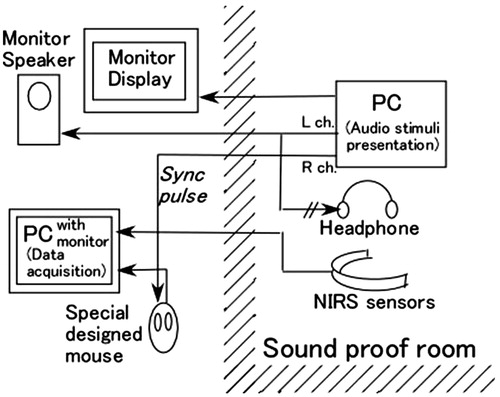
Figure 2. Sound spectrograms of the three test stimuli. Spectograms represent, from top to bottom, the JL, WM, and IS stimuli. The trace below each spectrogram represents the time waveform for each 27.5-s stimulus. The spectrograms each represent the first 3 s of the stimulus, indicated by the shaded area on the waveform trace.
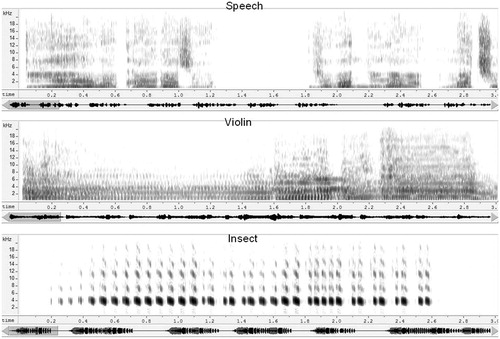
Figure 3. Typical pattern of hemispheric dominance index (DI) for three stimuli. Positive value means dominance and negative value means non-dominance.
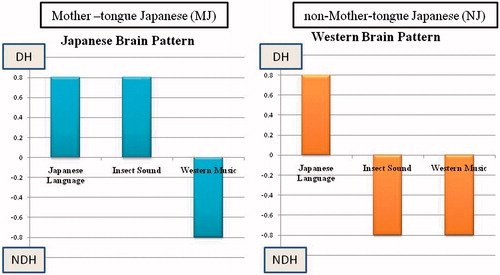
Table 1. Contingency table of hemispheric dominance pattern between groups.
Figure 4. Hemispheric dominance indices (DIs) for three stimuli (Mother-tongue Japanese). The three axes represent the dominance indices for the JL, WM, and IS stimuli. Each bar represents data from one MJ participant. The origin of each bar on the central plane indicates the DI values for JL and WM stimuli. The length of the bar indicates the DI value of the IS stimulus. Participants exhibiting the Japanese pattern are represented by red upward pointing bars, while those exhibiting the Western pattern are represented by green downward pointing bars. There were four participants exhibiting the Western pattern, but only three bars are visible. This is because two subjects both had DIs of 1 and −1 for JL and WM stimuli, respectively.
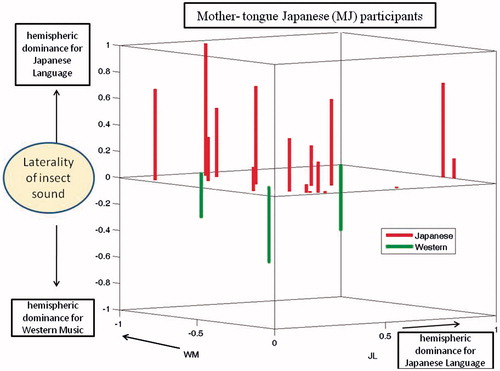
Figure 5. Hemispheric dominance indices (DIs) for three stimuli (non-Mother-tongue Japanese). As for Figure 5, but representing the non-MJ participants.
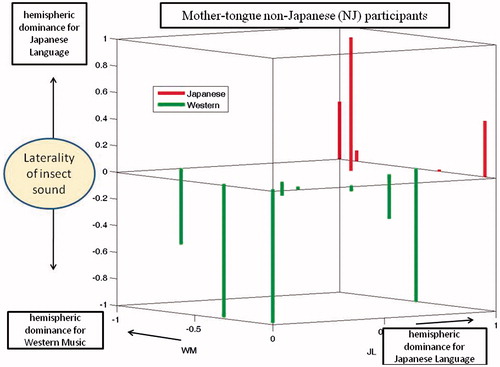
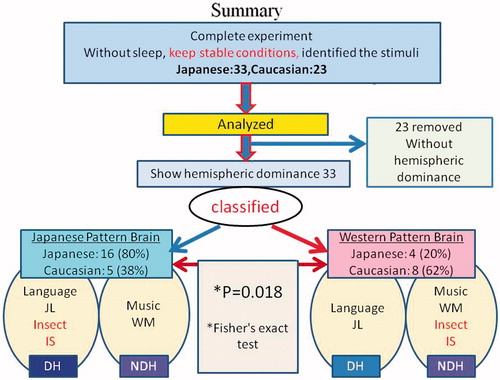
Figure 6. Schematic summarizing the results (before application of a DI threshold) and the participant-selection procedures leading up to them.