Figures & data
Table I. Primer sequences used for this report.
Figure 1. Schematic diagram of the genomic locus of cytochrome P4502D6 and the location of the various SNPs of interest.
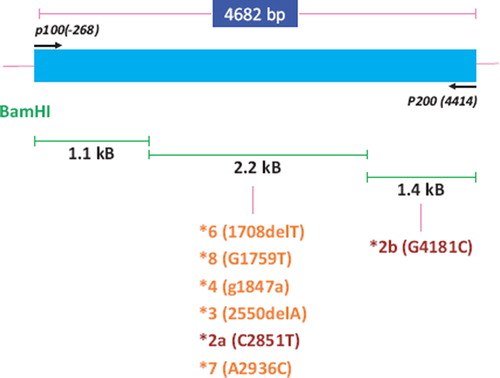
Figure 2. Workflow for multiplexed SNP analysis using capillary electrophoresis (right) and length of time required at each step (left).
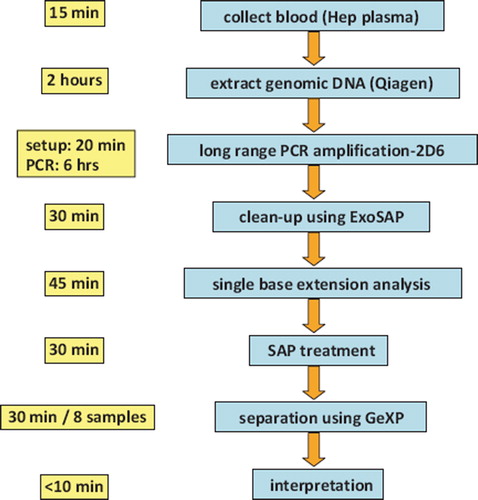
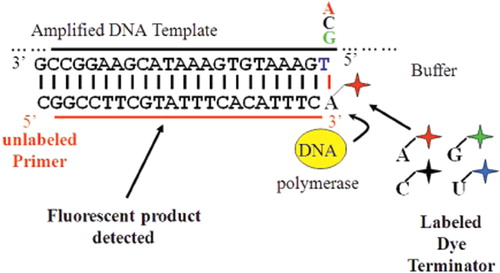
Figure 3. Schematic diagram of single base extension analysis. An oligonucleotide primer, sequence ending one nucleotide upstream of SNP of interest, is extended by one base with DNA polymerase. Each base if labelled with a different colour fluorophore allowing for interrogation of the SNP of interest at detection.