Figures & data
Figure 1. Schematic drawing of tandem-mass spectrometry.
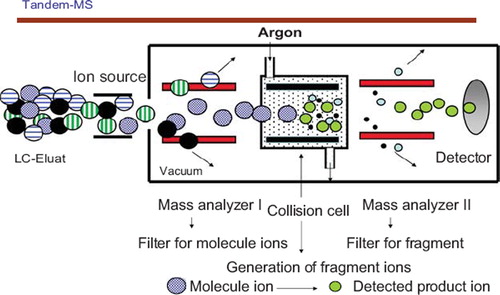
Figure 2. HPLC-MS/MS separation for a serum sample containing a) 25(OH)D3, b) 3-epi-25(OH)D3, c) 25(OH)D2, d) 24,25(OH)2D3 and e) d6-25(OH)D3, internal standard.
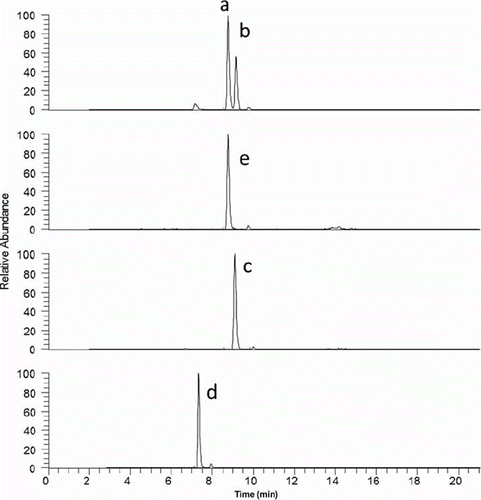
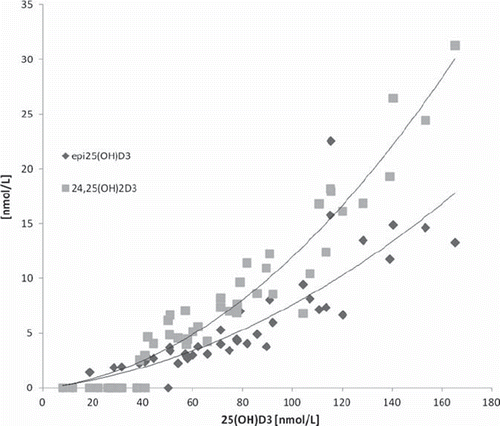
Figure 3. Concentration of epi25OHD3 and 24,25(OH)2D3 relative to 25(OH)D3 concentration in a set of patient samples.