Figures & data
Figure 2. Peak area responses as a function of spray voltage when injecting 40 μL samples containing 1 mg/L cystatin C and acquiring SIM data for the z + 12 peak (●, without degasser; ○, with degasser).
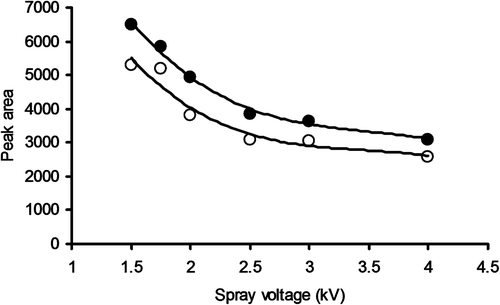
Figure 3. SIM chromatograms for a spinal fluid sample with GGGG-cystatin C added to a concentration of 15 mg/L. The top trace is cystatin C and the bottom one is GGGG-cystatin C.
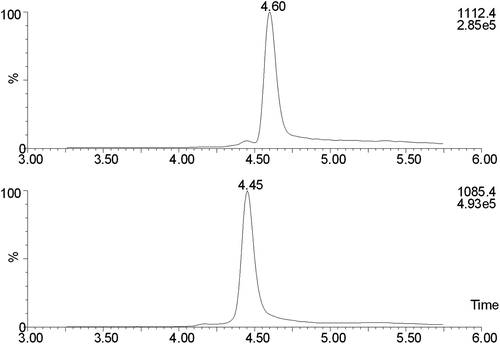
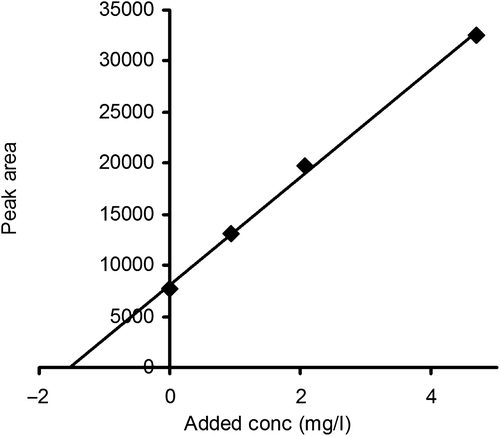
Figure 5. The ratio of the peak areas for cystatin C and GGGG-cystatin C in spinal fluid as a function of the added amount of cystatin C. The GGGG-cystatin C (the non-proteome reference protein) concentration was 15 mg/L in all samples.
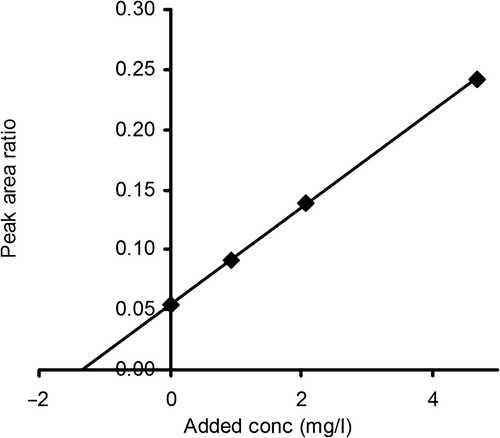
Table I. Cystatin C concentrations in four spinal fluid samples as analyzed by immunoturbidimetry and the LC-MS-based assays ‘standard addition’ and ‘LC-MS-with use of a non-proteome reference protein (LC-MS-NPRP). The percent columns refer to the results of the two LC-MS-based assays expressed as percentages of the immunochemical results.
Figure 6. SIM chromatograms of a standard of pure non-hydroxylated cystatin C (A) and of an intact spinal fluid sample (B). The trace for m/z 1112.7 represents non-hydroxylated cystatin C and 1114.1 represents the assumed hydroxylated cystatin C.
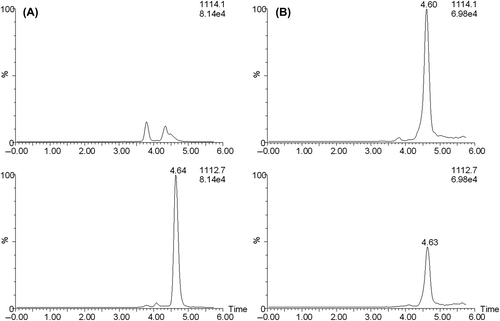
Table II. Cystatin C concentrations in four spinal fluid samples as analyzed by immunoturbidimetry and by the LC-MS-based assays ‘standard addition’ and ‘LC-MS-with use of a non-proteome reference protein (LC-MS-NPRP)’. The results of the MS-based assays are presented as concentrations of nonhydroxylated and monohydroxylated cystatin C and the corresponding sums. The percent columns refer to the results of the two LC-MS-based assays expressed as percentages of the immunochemical results.

