8,992
Views
33
CrossRef citations to date
0
Altmetric
Research Articles

Stability of 35 biochemical and immunological routine tests after 10 hours storage and transport of human whole blood at 21°C

, , , &
Pages 603-610 | Received 25 Jun 2013, Accepted 25 May 2014, Published online: 02 Jul 2014

Figures & data

Table I. Analytes, number of samples and range of values.

Table II. Imprecision (CV) and bias for 35 analytes. Results obtained after storage of whole blood at 21°C was compared to baseline results.

Figure 1. Imprecision and bias calculated for results obtained at baseline and after 10 h of storage of whole blood (in lithium-heparin or serum tubes). Data on imprecision (A) shows CV calculated from results obtained at baseline and after storage of whole blood in lithium-heparin or serum tubes at 21°C for 10 h. The analytical imprecision is indicated as grey columns and the goal imprecision as the total height of the columns. Data on bias (B) shows the mean bias between baseline and results obtained after storage of whole blood for 10 h. The columns indicate bias goal. Data for analytical- and goal-CV as well as bias goal are indicated for each analyte in .
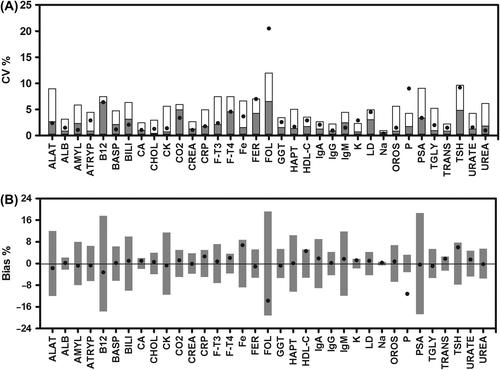
Figure 1. Imprecision and bias calculated for results obtained at baseline and after 10 h of storage of whole blood (in lithium-heparin or serum tubes). Data on imprecision (A) shows CV calculated from results obtained at baseline and after storage of whole blood in lithium-heparin or serum tubes at 21°C for 10 h. The analytical imprecision is indicated as grey columns and the goal imprecision as the total height of the columns. Data on bias (B) shows the mean bias between baseline and results obtained after storage of whole blood for 10 h. The columns indicate bias goal. Data for analytical- and goal-CV as well as bias goal are indicated for each analyte in Table II.

Figure 2. Bland-Altman plots of results obtained after storage of whole blood (in lithium-heparin or serum tubes) for 10 h prior to analysis as compared to results at baseline. Fraction: Ratio between baseline results and results at 10 h. Indicated on each figure is the line of identity, i.e. baseline/10 h = 1.0 (bold dashed line), the analytical CV (thin dashed line), goal-CV (full drawn thin line) and the reference interval (shaded area). Data for analytical- and goal-CVs are indicated for each analyte in .
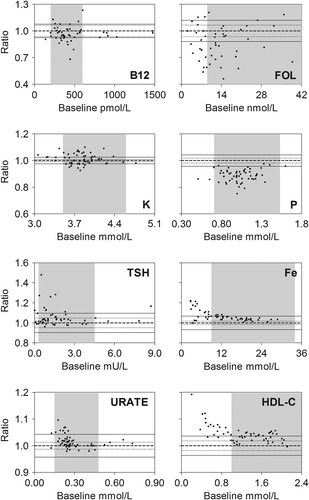
Figure 2. Bland-Altman plots of results obtained after storage of whole blood (in lithium-heparin or serum tubes) for 10 h prior to analysis as compared to results at baseline. Fraction: Ratio between baseline results and results at 10 h. Indicated on each figure is the line of identity, i.e. baseline/10 h = 1.0 (bold dashed line), the analytical CV (thin dashed line), goal-CV (full drawn thin line) and the reference interval (shaded area). Data for analytical- and goal-CVs are indicated for each analyte in Table II.