1,359
Views
15
CrossRef citations to date
0
Altmetric
ORIGINAL ARTICLE

Comparison of fibrin-based clot elasticity parameters measured by free oscillation rheometry (ReoRox®) versus thromboelastometry (ROTEM®)

, , , &
Pages 239-246 | Received 08 Sep 2014, Accepted 27 Nov 2014, Published online: 19 Jan 2015

Figures & data

Figure 1. ReoRox® and ROTEM® output traces. The ReoRox® device displays information on viscosity (dashed curve) and elasticity (plain curve) during the coagulation process (A). Viscosity parameters include the time of the initial formation of fibrin strands (COT1) and the time to complete clot formation (COT2) before the clot starts to strengthen. Clot strength is represented by the maximum elasticity parameter G'max obtained either in the absence (Fibscreen1 G'max) or presence (Fibscreen2 G'max) of platelet inhibitor. Similar coagulation parameters are obtained with the ROTEM® system (B), the equivalent of COT2 being the clotting time (CT, time from start to 2 mm amplitude). Maximum clot firmness (MCF) parameters, obtained either in the absence (EXTEM test) or presence (FIBTEM test) of platelet inhibitor, can be converted into maximum clot elasticity (MCE) parameters, using the following formula: MCE = (MCF × 100)/(100 − MCF).

Figure 1. ReoRox® and ROTEM® output traces. The ReoRox® device displays information on viscosity (dashed curve) and elasticity (plain curve) during the coagulation process (A). Viscosity parameters include the time of the initial formation of fibrin strands (COT1) and the time to complete clot formation (COT2) before the clot starts to strengthen. Clot strength is represented by the maximum elasticity parameter G'max obtained either in the absence (Fibscreen1 G'max) or presence (Fibscreen2 G'max) of platelet inhibitor. Similar coagulation parameters are obtained with the ROTEM® system (B), the equivalent of COT2 being the clotting time (CT, time from start to 2 mm amplitude). Maximum clot firmness (MCF) parameters, obtained either in the absence (EXTEM test) or presence (FIBTEM test) of platelet inhibitor, can be converted into maximum clot elasticity (MCE) parameters, using the following formula: MCE = (MCF × 100)/(100 − MCF).

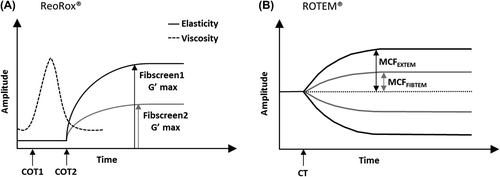
Table I. Stability analysis in re-calcified citrated blood samples. Stability of fibrin-based clot strength parameters of blood samples from two healthy volunteers was assessed (with a minimum of 12 measurements each) with the ROTEM® FIBTEM and ReoRox® Fibscreen2 tests.

Figure 2. Comparison of functional fibrinogen in undiluted and diluted re-calcified citrated blood samples obtained with the ROTEM® and ReoRox® devices. Blood samples were diluted at 33% and 50% with saline (NaCl), gelatin (GEL) and hydroxyethyl starch (HES). Duplicates of each dilution of blood samples from six different volunteers were evaluated with (A) the derived FIBTEM maximum clot elasticity (MCE) and (B) Fibscreen2 maximum elasticity (G'max). For each group, the median is represented by a bar within a box (extending from the 25th to 75th percentiles). Whiskers extend from the smallest to the largest values.

Figure 2. Comparison of functional fibrinogen in undiluted and diluted re-calcified citrated blood samples obtained with the ROTEM® and ReoRox® devices. Blood samples were diluted at 33% and 50% with saline (NaCl), gelatin (GEL) and hydroxyethyl starch (HES). Duplicates of each dilution of blood samples from six different volunteers were evaluated with (A) the derived FIBTEM maximum clot elasticity (MCE) and (B) Fibscreen2 maximum elasticity (G'max). For each group, the median is represented by a bar within a box (extending from the 25th to 75th percentiles). Whiskers extend from the smallest to the largest values.

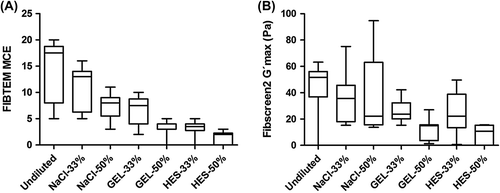
Table II. Fibrin-based clot strength parameters of citrated undiluted and hemodiluted blood samples. Undiluted and hemodiluted (33% and 50% with saline, gelatin or hydroxyethyl starch [HES]) blood of samples of healthy volunteers (n = 6) were assessed with the ROTEM® FIBTEM (A5, A10, A20, MCF, MCE) and ReoRox® Fibscreen2 (G'max) tests. Values are presented as median [25th percentile – 75th percentile].

Figure 3. Correlation of FIBTEM MCE and Fibscreen2 G'max. Maximum clot elasticity (MCE) derived from the ROTEM® FIBTEM test of blood samples from six different volunteers were plotted against the maximum elasticity parameter (G'max) given by the ReoRox® Fibscreen2 test. Citrated blood samples were run as duplicates in each test, undiluted or diluted (33% and 50%) with saline, gelatin and hydroxyethyl starch. Bold line: regression curve (y = 2.413 x + 10.19); dotted lines: 95% prediction/confidence band