Figures & data
Figure 1. Phase contrast microscopy of SV40LT-HFL cells. (A) Derived from one colony after 13 days of culture in medium with puromycin, (B) from a single colony after 2 months with puromycin selection, (C) showing cells with two or three nuclei, typical of differentiating hepatocytes and (D) control adult hepatocytes. Scale bar A, B & D = 10 µm, C = 40 µm.
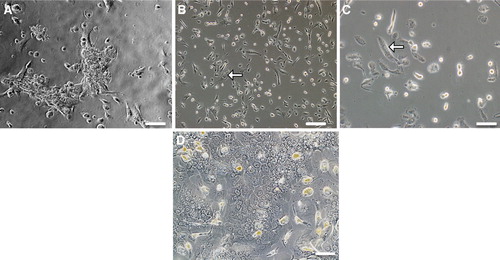
Figure 2. Characterization of SV40LT-HFL cells. Immunofluorescent staining of SV40LT-HFL cells in passages 12 (left) and 22 (right) showing in A, from left to right, the detection of cytoplasmic staining of hepatic markers CK8, 18 and albumin. The level of expression as judged from the intensity of staining was similar in both passages. In B, the same cells are stained with the nuclear stain, DAPI. In A, from left to right, positive cytoplasmic staining of CYP3A4/7 and nuclear staining of transcription factors HNF-1α and HNF-4α is seen in all cells. In B, the same cells are stained with the nuclear stain, DAPI. In C, a small number of cells staining positive for the hepato-biliary marker CK19 was detected in both early and late passages. (Magnifications 40×)
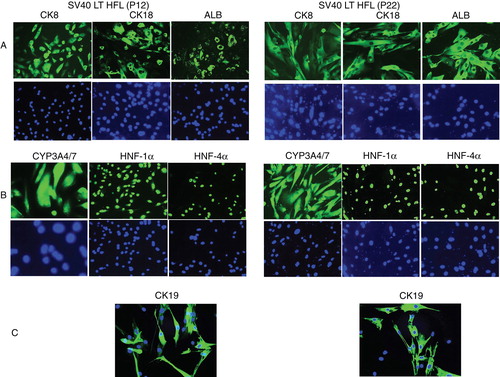
Figure 3. Staining of SV40 LT HFL cells for cancer-associated markers. (A) Immunofluorescent staining with an antibody to SV40 LT antigen demonstrated strong expression of the SV40 LT antigen in nuclei of all the cells at passage 22, as revealed after staining of the same cells with the nuclear stain, DAPI (B). (C) Immunofluorescent staining of SV40 LT-HFLcells in passage 11 and the liver cancer cell line, HepG2, for cancer-associated markers Ber EP4, MOC-31 and p53. The SV40 LT-HFL cells were negative for all the three markers, while Hep G2 cells were positive for Ber EP4 and MOC-31, but not p53. (D) Enzymatic staining of the transfected SV40 LT-HFL cells and liver cancer cell line HepG2 cells showing the expression of glucose -6-phosphatase and glycogen in the transfected cells but not the cancer cell line Hep G2. (Magnifications 20×).
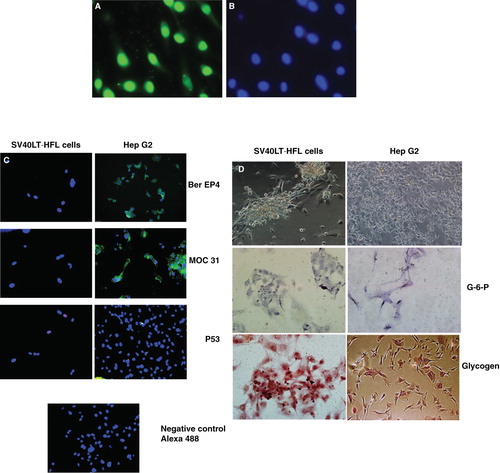
Figure 4. Flow cytometric and RT-PCR analysis of SV40LT-HFL cells. (A) Flow cytometry of SV40LT-HFL cells showed expression of the progenitor cell markers EPCAM, CD133 and CD90 in early passages with decreased expression in the later passages. Dlk-1 was not detected in early or late passages (p11 and 22 respectively). In addition, the cells also expressed the hepatic markers albumin, CK 8, CK18, confirming our immunocytochemical results. No expression of CD271 a mesenchymal stem cell marker was observed. The cells did not express the hematopoietic marker CD34 or the leukocyte marker CD45. (B) RT-PCR analysis of SV40LT-HFL cells in passage 10 showing expression of detoxifying factor CYP3A7, albumin and transcription factor HNF-4α. The cells however, did not express CYP3A4 found in adult hepatocytes. β-actin was used as housekeeping gene. (C) HepG2 cells served as positive control, and expressed CYP3A4, CYP3A7, HNF-4α, HNF-1β and albumin transcripts as revealed by RT-PCR.
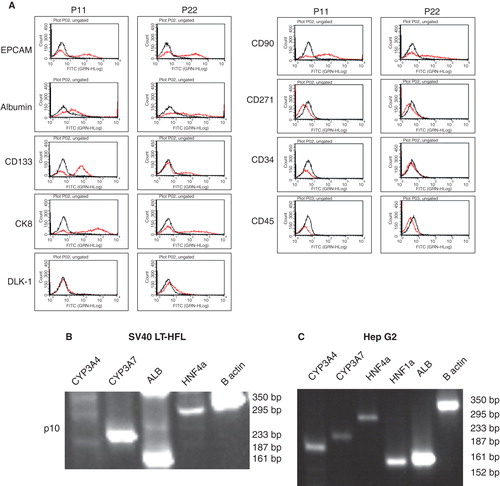
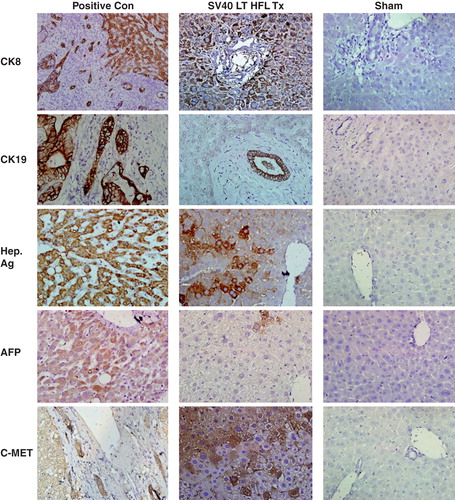
Figure 5. Expression of human liver-specific markers in the livers of nude mice transplanted with SV40 LT hFLCs. Two million SV40 LT HFL were transplanted into the spleen of D-galactosamine treated nude mice that underwent 30% partial hepatectomy at the time of transplantation. Immunohistochemistry was performed on fresh frozen liver sections of transplanted animals, and small clusters of human CK8-, CK19-, hepatocyte specific antigen-, and c-Met-expressing, engrafted cells (dark red-brown) with hepatocyte morphology were detected throughout the liver. Some cells expressing alphafeto protein were also detected. Biopsy sections from patients with liver cancer served as positive control and staining of liver sections from sham transplanted animals served as negative control. HE was used as counter-stain. (Magnification 40×.) CK, cytokeratin; Hep Ag, hepatocyte-specific antigen; AFP, alphafeto protein.