
Figures & data
Figure 1. Corpus mucosa with “active” chronic gastritis (A): Inflammation is mononuclear but is accompanied with neutrophils and eosinophils (arrows) which penetrate into the surface epithelium. Normal (B): Normal corpus mucosa without any sign of inflammation is shown as a reference. HE stain × 500.
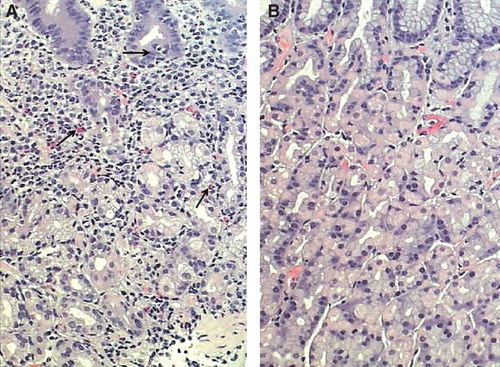
Figure 2. Corpus mucosa. Normal (A): The layer of oxyntic glands is normal suggesting that the corpus mucosa is capable to secrete hydrochloric acid normally. Non-atrophic gastritis (B): Mild mononuclear inflammation is seen in upper layer (foveolar part) of the mucosa (“superficial chronic gastritis”) as indicated with arrows. The gland layer is intact suggesting that the acid secretion is normal in spite of the gastritis. Moderate atrophic gastritis in corpus (C): Intense chronic mononuclear inflammation occurs also in lower layers of the mucosa and is accompanied with a marked loss (atrophy) of normal oxyntic glands. The observation suggests that the stomach is hypochlorhydric but is not achlorhydric. Acid secretion is impaired due to loss of the parietal cells. Severe atrophic gastritis in corpus (D): Chronic inflammation is mild but all oxyntic glands are totally gone. Some foci of intestinal metaplasia occur in the lower right corner. Stomach is certainly acid free (achlorhydric). The patient is at risk for malabsorption of vitamin B12, and also the absorption of micronutrients (iron, calcium, magnesium and zinc) may be impaired. The pathologist may have difficulties to find Helicobacter pylori organisms in cases like this even though the atrophic gastritis would be of H. pylori origin. Instead, a mixed microbial flora (microbes other than H. pylori) is a common finding on the surface mucosa in cases like this. Alcian blue – PAS and modified Giemsa stains × 300.
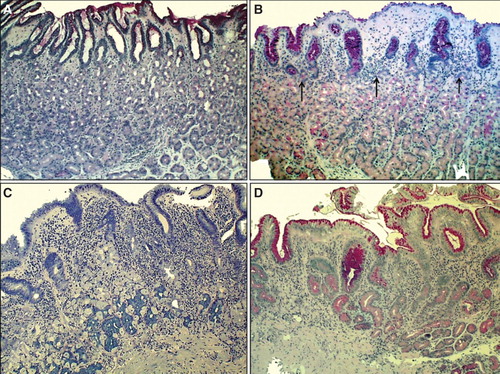
Figure 3. Antral mucosa. Normal (A): Normal number of antral G cells with typical “hallo” appearances occur in neck area of the pyloric glands (arrows). Non-atrophic chronic gastritis (B): Mononuclear inflammation occupies the whole mucosa giving an impression of gland loss (atrophy). Atrophic gastritis of mild to moderate degree in antrum (C): Inflammation is relative mild but there is a large area of pyloric glands lost and replaced with metaplastic glands (IM) as indicated with arrows. Severe atrophic gastritis in antrum (D): All pyloric glands are gone and the whole mucosa is “intestinalized”. Inflammation is mild, or moderate at most. Also the antral G cells are disappeared along with the loss of the normal pyloric glands. Therefore, the G-17 feedback response in physiological control of acid secretion is impaired. HE and Alcian blue – PAS stains × 300.
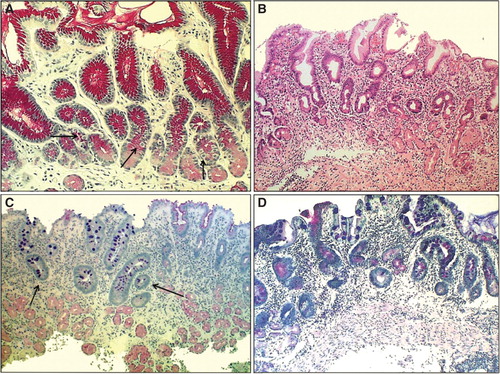
Figure 4. Mean age-specific prevalence of total chronic gastritis and atrophic gastritis in biopsy samples from ∼500 consecutive endoscopy Finnish outpatients in the late 80s (Jorvi hospital, Espoo, Finland). The mean prevalences increase with age.
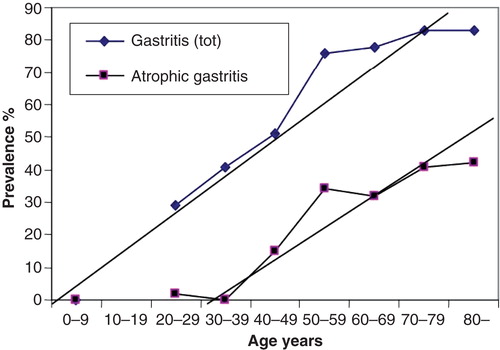
Figure 5. Scheme on natural course and progression of Helicobacter pylori gastritis from a non-atrophic form to gastric malignancy (sc. “Correa cascade”). Several potentially pathogenetic factors and mechanisms, linked with carcinogenesis, play a role and are triggered stepwise on during the course and progression of the cascade.
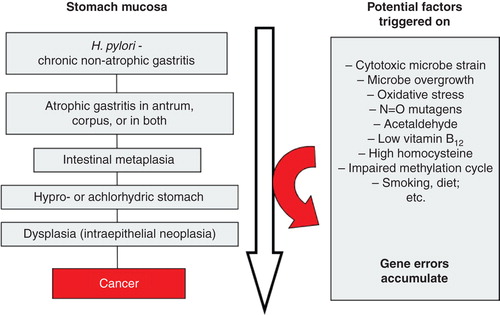
Figure 6. A computer simulation to demonstrate the “birth cohort phenomenon” in prevalence of Helicobacter pylori gastritis in a population consisting of cohorts with dissimilar birth years. Approximated from data on gastritis in Finland around the late 80s (see ).
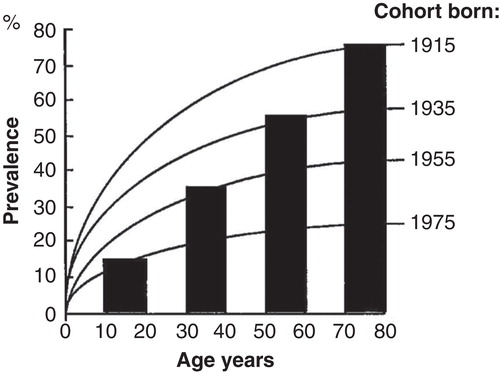
Figure 7. Relative risk of peptic ulcer disease (duodenal or gastric ulcer) or gastric cancer in various phenotypes of chronic atrophic Helicobacter pylori gastritis. The risks are presented as relative risks compared to risks in subjects with normal and healthy stomach mucosa (N/N category; yellow). The risks are extrapolated and estimated from a case-control study done in Finland in the 80s [Citation69]. Note that the risks of peptic ulcer diseases and gastric cancer are associated with very dissimilar phenotypes of chronic gastritis.
![Figure 7. Relative risk of peptic ulcer disease (duodenal or gastric ulcer) or gastric cancer in various phenotypes of chronic atrophic Helicobacter pylori gastritis. The risks are presented as relative risks compared to risks in subjects with normal and healthy stomach mucosa (N/N category; yellow). The risks are extrapolated and estimated from a case-control study done in Finland in the 80s [Citation69]. Note that the risks of peptic ulcer diseases and gastric cancer are associated with very dissimilar phenotypes of chronic gastritis.](/cms/asset/bfdf77d4-c443-4070-8705-fdc8c27dc65e/igas_a_1019918_f0007_oc.jpg)
Figure 8. OLGA staging for risk of stomach cancer. Modified from a paper of Rugge et al [Citation79]. The staging is a practical tool for the delineation of patients to high (stages III–IV) and low (stages 0–II) risk groups for cancer, for gastric cancer of the intestinal type in particular. The staging requires endoscopy and proper biopsy practice but can also be done non-invasively by a blood test with applying specific biomarkers (pepsinogen I and II, gastrin-17 and Helicobacter pylori serology) that reflect the function (acid secretion) and the structure of both antral and corpus mucosa in the blood plasma/serum.
![Figure 8. OLGA staging for risk of stomach cancer. Modified from a paper of Rugge et al [Citation79]. The staging is a practical tool for the delineation of patients to high (stages III–IV) and low (stages 0–II) risk groups for cancer, for gastric cancer of the intestinal type in particular. The staging requires endoscopy and proper biopsy practice but can also be done non-invasively by a blood test with applying specific biomarkers (pepsinogen I and II, gastrin-17 and Helicobacter pylori serology) that reflect the function (acid secretion) and the structure of both antral and corpus mucosa in the blood plasma/serum.](/cms/asset/ec9cf8ba-f2af-46c8-9f9a-93e8c7d20c55/igas_a_1019918_f0008_oc.jpg)