Figures & data
Table 1. Baseline patient demographics and clinical characteristics.
Table 2. Montreal classification in CD patients at enrolment (total number of patients = 30).
Table 3. Montreal classification in UC patients at enrolment (total number of patients = 22).
Figure 1. Median disease activity scores at baseline and after 14 weeks of treatment with CT-P13. (A) Crohn’s Disease Activity Index (CDAI) score in patients with Crohn’s disease. (B) Mayo score in patients with ulcerative colitis.
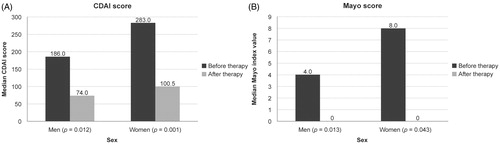
Figure 2. Median levels of C-reactive protein (CRP) at baseline and after 14 weeks of treatment with CT-P13 in patients with inflammatory bowel disease.
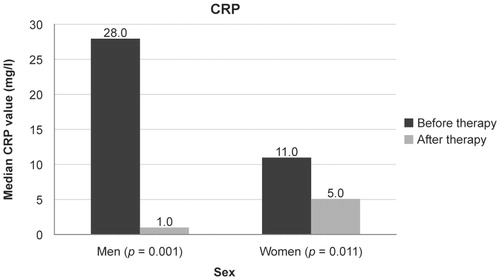
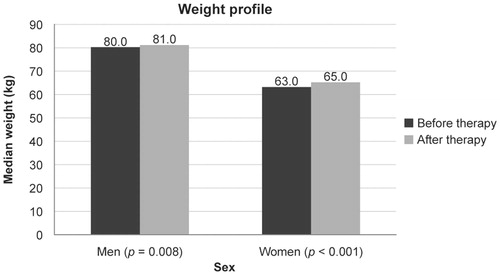
Figure 3. Median weight at baseline and after 14 weeks of treatment with CT-P13 in patients with inflammatory bowel disease.