Figures & data
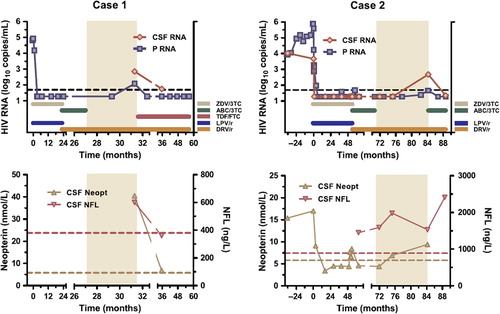
Figure 1. Two cases of CSF escape during darunavir/r monotherapy (period shaded). Upper panels show cerebrospinal fluid (CSF) and plasma (P) HIV RNA together with treatment history; time 0 represents first initiation of antiretroviral treatment; dotted lines correspond to 50 copies/ml. Lower panels show CSF neopterin and neurofilament light protein (NFL) concentrations; dotted lines represent upper normal limits.