Figures & data
Figure 1. Macrophages stained for CD68 in human precision-cut lung slices (CitationSwitalla et al. 2010). Untreated slices were stained with anti-human CD68 antibodies and subsequently incubated with Cy5-conjugated F(ab′)2 fragments. The appropriate isotypes were used as controls for staining specificity. Precision-cut lung slices were mounted with ProLong Gold anti-fade to avoid bleaching, and fluorescence was detected by confocal laser scanning microscopy (40× water immersion objective, 633 nm, emission filter LP680, thickness 20 µm, major grid spacing = 50 µm).
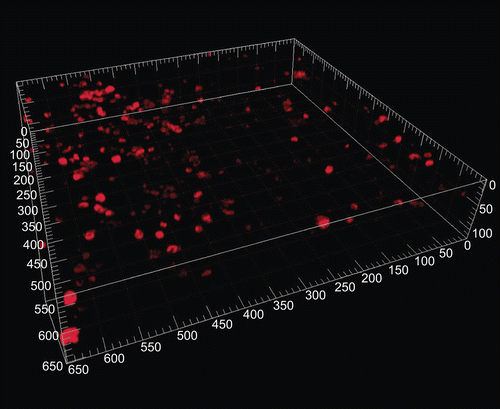
Figure 2. Airway mucosal dendritic cells forming a three-dimensional network within the airway mucosa. They display a typical dendritic morphology, with long, branched arms interdigitating between surrounding epithelial cells. The image shows a three-dimensional reconstruction of a confocal image showing CD11c+ DCs in a murine lung section. The image was taken at the proximal 1/4 of the main axial pathway of the left lung. The smooth muscle was visualized by phalloidin-staining of F-actin filaments (CitationVeres et al. 2007, by courtesy of T. Veres). Picture was reproduced with permission from CitationSewald and Braun (2011).
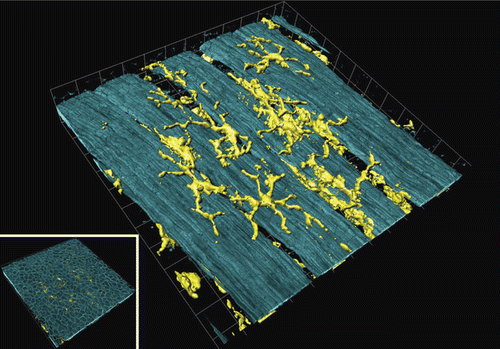
Figure 3. Image analysis of time-dependent cell death in murine precision-cut lung slices. Tissue slices were stained with 4 µM calcein AM and 4 µM EthD-1 after 4 h (A), 24 h (B), 48 h (C), and 72 h (D) of cultivation and after cell lysis (E). The images were examined by two-colour immunofluorescence confocal microscopy (40× water immersion objective, excitation wavelengths 488 nm and 543 nm, emission filters BP 505–550 nm and LP 560 nm, thickness 20 µm, grid spacing = 20 µm) and analysed with IMARIS 4.5.2. Red colour shows cell nuclei (Ø 5 µm) of dead cells and green colour the cytoplasm of viable cells. Picture was reproduced with permission from CitationHenjakovic et al. 2008a.
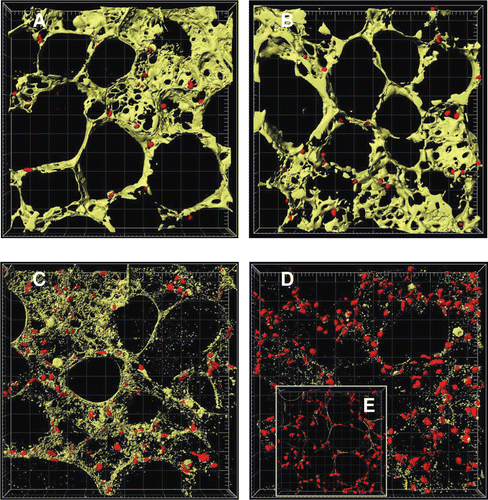
Figure 4. IL-1α and TNF-α in human precision-cut lung slices (A, C) and bronchoalveolar lavage (BAL) fluid from asthmatic patients after provocation with LPS (B, D). TNF-α levels in culture supernatants and IL-1α levels in lysates were determined by ELISA in human precision-cut lung slices after 24 h of culture. Cytokine amounts in BAL fluid of 17 non-smoking subjects were determined using Luminex technology (CitationSchaumann et al. 2008). Data are presented as mean ± SEM for precision-cut lung slices from 12 donors, *p < 0.05; **p < 0.01; ***p < 0.005 (one-way ANOVA Dunnett’s test for precision-cut lung slices, t-test for BAL).
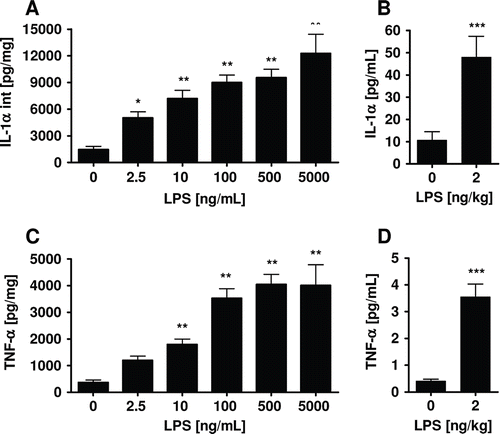
Figure 5. Ex vivo staining of MHC class II in live murine precision-cut lung slices after 24 h. The images were taken by confocal microscopy. A limited number of MHC class II+ cells were found in alveolar regions displaying DC morphology. Inset in the bottom left corner shows the respective isotype antibody control.
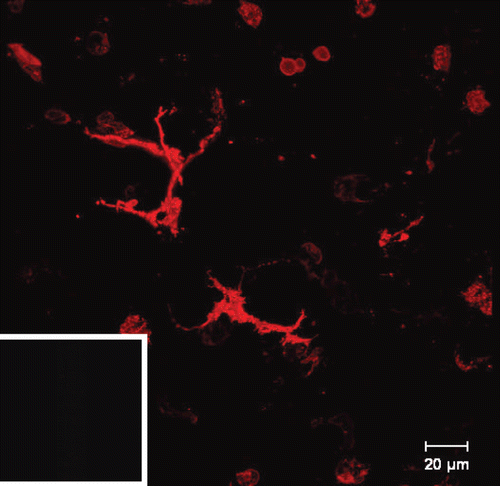
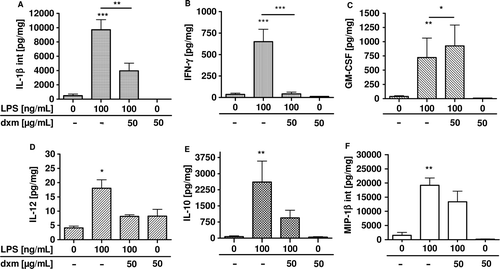
Figure 6. Total production of GM-CSF, IL-12, IL-1β, IL-10, MIP-1β, and IFN-γ in human precision-cut lung slices after 24 h of incubation with lipopolysaccharide and dexamethasone (CitationSwitalla et al. 2010). Cytokine levels in culture supernatants and after lyses were determined by MSD technology. Data are presented as mean ± SEM, *p < 0.05; **p < 0.01; ***p < 0.005 (GM-CSF, IL-12, IFN-γ, and MIP-1β: n = 3, IL-1β and IL-10: n = 6). dxm, dexamethasone, GM-CSF, granulocyte-macrophage colony-stimulating factor, IFN, interferon, IL, interleukin, int, intracellular, MIP, macrophage inflammatory protein.