Figures & data
Figure 1. In vitro differentiation of HepaRG® cells. (A) Phase-contrast photographs of HepaRG® cells at the proliferative stage (D1: low-density culture), and the differentiative stage (D7: confluent culture; D21 and D35: differentiation culture with 1.7% DMSO). D1, 7, 21 and 35 in HepaRG® stage indicate the number of days after seeding. Bar = 100 μm. (B) The relative expression of 26 human drug metabolism-related mRNAs on D1, 7, 21 or 35 in the HepaRG® cells was assessed by qPCR. Each bar represents the average of two independent determinations, and the standard error is shown.
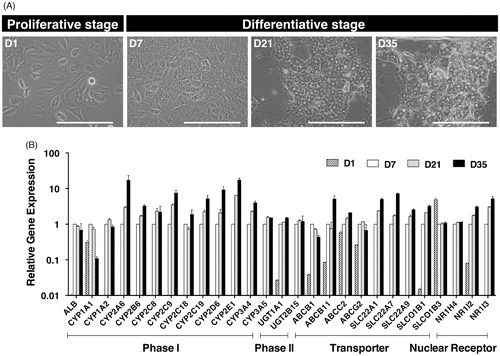
Figure 2. Reconstitution of human liver structures from differentiated HepaRG® cells in vivo. Hepatocyte-like colonies (upper panel) and biliary-like colonies (lower panel) in a TK-NOG mouse liver that was transplanted with differentiation D35 HepaRG® cells were subjected to immunohistochemical analysis. Serial liver sections were stained for H&E, HLA, hAlb and CK-19. Bar = 100 μm.
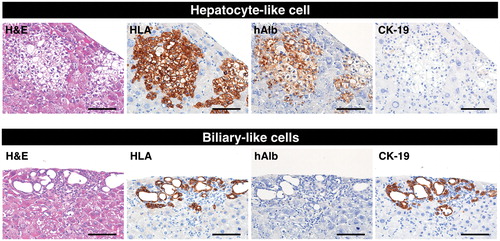
Table 1. Colony-forming ability of various differentiation stages of HepaRG® cells in TK-NOG livers.
Table 2. Engraftment of cryopreserved human hepatocytes in TK-NOG livers.
Figure 3. Expression of functional liver markers in reconstituted livers from TK-NOG mice. Hepatocyte-like colonies in a TK-NOG mouse liver that was transplanted with differentiation D21 HepaRG® cells (upper panel) and human hepatocyte colonies in a TK-NOG mouse liver that was transplanted with cryopreserved human hepatocytes (HEP187170; 26 years, female) (lower panel) were assessed for functionality by histochemical and immunohistochemical analyses. Serial liver sections were stained for H&E, PAS, CYP3A4 and MRP2. Bar = 100 μm.
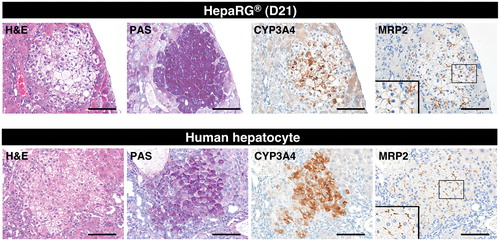
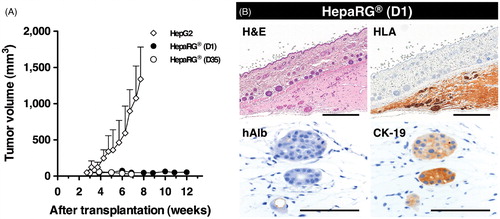
Figure 4. Tumorigenic potency of HepaRG® cells in NOG mice. (A) The growth potential of HepaRG® cells was evaluated in NOG mice. A total of 1 × 10⁶ cells were subcutaneously transplanted into NOG mice. D1 and D35 in HepaRG® stage indicate the number of days after seeding. A total of 1 × 10⁴ HepG2 cells were used as positive control for s.c. transplantation. (B) Histologic and immunohistochemical analyses of D1 HepaRG® xenografts in NOG mouse. Twelve weeks after transplantation, the xenografts were processed for H&E staining, HLA, hAlb and CK-19 staining. Bar = 500 μm, Bar = 50 μm.