Figures & data
Figure 1. Illustration of evaluation data presentation to faculty. One sample learning goal with high, moderate or low learning outcome is displayed for each of the three learning domains (knowledge, skills and attitudes). Questions were translated from their original German into English. Error bars indicate standard errors of the mean. CSA, comparative self-assessment.
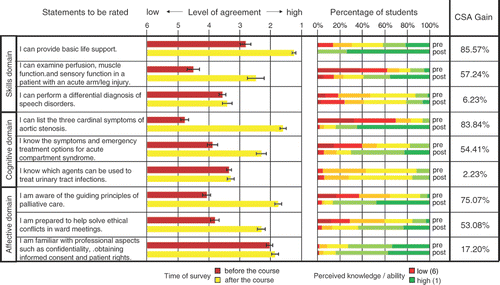
Figure 2. Comparison of different methods measuring differences in student self-ratings before and after attending the cardio-respiratory module. Each colour represents one specific learning objective: dark green – pharmacotherapy for heart failure; light green – therapy for acute myocardial infarction; yellow – heart murmurs; orange – signs of heart failure on physical examination; red – therapeutic options for peripheral vascular disease. (A) mean values of student ratings before (dotted lines) and after (solid lines) the module. Error bars indicate standard errors of the mean. (B) absolute differences in mean values for each learning objective across the four cohorts. (C) effect sizes of pre-post changes in student self-assessments. (D) CSA gain computed from Formula 1 (see text).
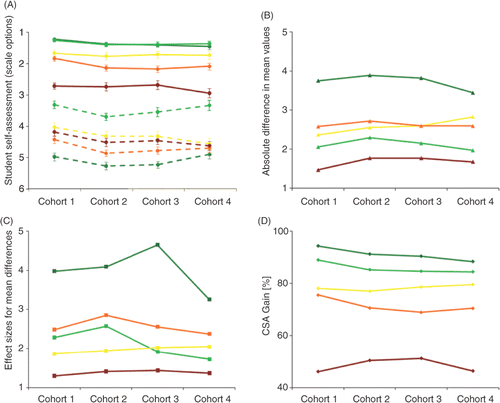
Figure 3. Impact of comparison type (matched vs. unmatched) and response rate on computed gain for the learning objective ‘ECG interpretation’. Each data point represents a student cohort. (A) correlation between gains computed from pair-wise comparisons and gains computed from group mean comparisons (r = 0.992, p = 0.008). (B) correlation between gains calculated for all students and those calculated for the subgroup of students voluntarily using the new programme evaluation tool (r = 0.981, p = 0.019).
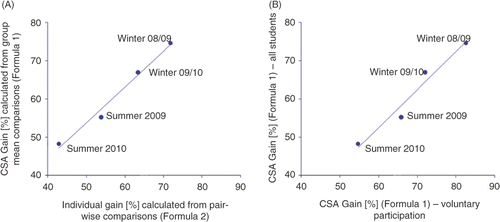
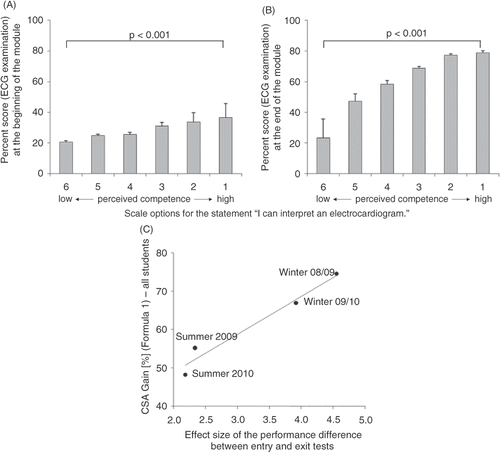
Figure 4. Relation of calculated gain values to objective performance measurements. (A) student performance level in the ECG entry examination by self-perceived competence to interpret an ECG (n = 636). (B) student performance level in the ECG exit examination by self-perceived competence to interpret an ECG (n = 636). (A/B) p values derived from Kruskal–Wallis–H Test. (C) correlation between pre-post performance difference effect sizes and gain as computed from student self-ratings (r = 0.980, p = 0.020). CSA, comparative self-assessment.