Figures & data
Figure 1. Measurements of the GCC and cpRNFL thicknesses using the RTVue-100. (A) The GCC protocol. The GCC measurements consisted of one horizontal line scan 7 mm in length and 15 vertical line scans 7 mm in length taken at 0.5-mm intervals in a 7 × 7 mm area. The GCC thickness was defined as the distance between the inner limiting membrane and the outer border of the inner plexiform layer. (B) The ONH protocol. The ONH measurements were performed with 13 concentric circle ring scans and 12 radial line scans. GCC = ganglion cell complex; cpRNFL = circumpapillary retinal nerve fibre layer; ONH: optic nerve head map; RE: right eye.
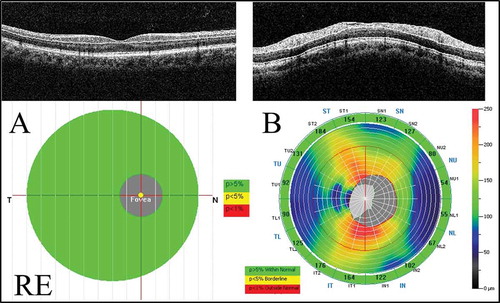
Table 1. The clinical data for the patients with non-arteritic anterior ischaemic optic neuropathy.
Table 2. The demographic characteristics of the normal control subjects and patients with NAION.
Table 3. The time course of the GCC and cpRNFL thicknesses determined using SD-OCT in patients with NAION.
Figure 2. The time course of SD-OCT parameters in the NAION patients. (A) The GCC thickness. There was a significant reduction of the total and superior GCC thicknesses observed at 1 month compared with those at the initial visit (*p < 0.05 and **p < 0.01, respectively). (B) The GCC parameters. The FLV and GLV were significantly increased at 1 month compared with the initial visit (**p < 0.01). (C) The cpRNFL thickness. Each cpRNFL thickness was significantly reduced at 1 month compared with the value at the initial visit (total and superior: **p < 0.01, inferior: *p < 0.05). SD-OCT = spectral domain optical coherence tomography; NAION = non-arteritic anterior ischaemic optic neuropathy; FLV = focal loss volume; GLV = global loss volume.
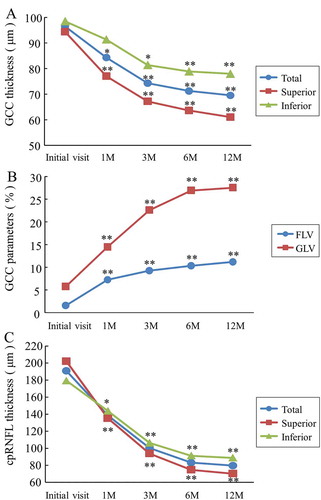
Figure 3. The time course of the mean ratio of the GCC and cpRNFL thickness in the NAION eyes to the normal control eyes. (A) The GCC thickness. The reduction rate of the GCC thickness at 12 months was the highest in the superior region. (B) The cpRNFL thickness. The superior cpRNFL thickness was significantly increased at the initial visit, and the loss rate was the highest at 12 months.
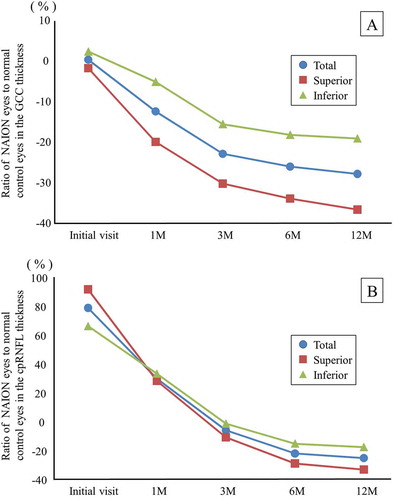
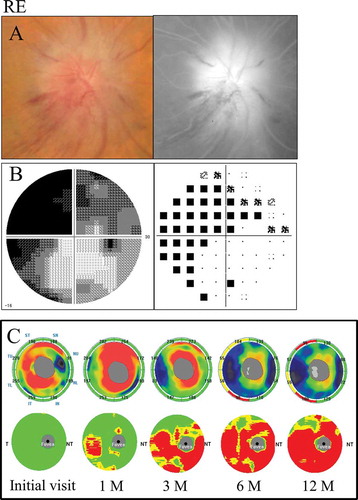
Figure 4. A 66-year-old female with inferior altitudinal field loss (case 1). (A) Left: a fundus photograph showed optic disc swelling; Right: FA images showed leakage of the optic disc. (B) Left: grey scale; Right: pattern deviation. The Humphrey visual field test showed inferior altitudinal field loss along the horizontal meridian. (C) Top: the cpRNFL significance map; Bottom: the GCC significance map. The cpRNFL significance map was increased at the initial visit and at 1 month due to optic disc swelling, and a significant reduction was observed at 3 months in the superior temporal sectors. The GCC significance map at 1 month showed thinning of the superior hemifield along the horizontal meridian corresponding to the inferior altitudinal field loss. The thinning area gradually spread over time. LE = left eye.

Figure 5. A 72-year-old male with diffuse visual field loss that was more dense superiorly (case 5). (A) Left: a fundus photograph showed severe optic disc swelling with splinter haemorrhage; Right: FA images showed the leakage of the optic disc and a filling delay in the inferior region. (B) Left: grey scale; Right: pattern deviation. The Humphrey visual field test showed diffuse visual field loss that was more dense in the superiorly. (C) Top: the cpRNFL significance map; Bottom: the GCC significance map. The cpRNFL significance map was increased until 3 months due to optic disc swelling, and significant thinning was observed in the inferior sectors at 6 months and in the superior and inferior sectors at 12 months. The GCC significance map showed thinning of the area at 1 month after the onset. Moreover, the GCC thickness at 3 months indicated predominant thinning of the inferior hemifield corresponding to the diffuse visual field loss, which was denser in the superior region. However, the thinning area expanded beyond the horizontal meridian over time. The GCC significance map showed good agreement with the visual field loss pattern. RE = right eye.