Figures & data
Figure 1. Isolation of specific brain regions from labeled and unlabeled rats. (a) Male F1 generation rats fed either control or isotopically labeled lysine–enriched chow (see Materials and Methods). (b) Rat brain regions are surgically isolated. (c) Ventral tegmental area (VTA; outlined in yellow) is removed, stained, and cut into defined volumes. (d) LCM produces five sections per slice (outlined in yellow), by laser-melding onto MacroCaps (see Materials and Methods). (e) Three MacroCaps are used per single sample, three rats and five slices per Macrocap. (f) Protein eluates are produced by serially extracting each group of MacroCaps in the same 100 μL of extraction buffer (see text).
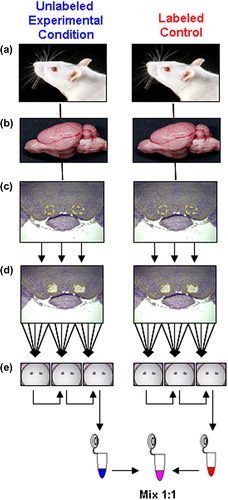
Figure 2. Litter size and weight on normal and heavy isotope diet. Mean litter weights were reported as a function of the number of days postweaned pups were fed labeled or unlabeled rat chow (error bars are included but the standard deviations are minimal and thus not visible). HD = heavy dame (placed on the labeled diet 2 days into confirmed pregnancy); LD = light dame (fed similar, but unaltered, diet); n = the number of male pups included in each birth group. The data point for day 1 represents n = 1 per cohort.
Figure 3. In vivo heavy isotope labeling of proteins measured in ventral tegmental (VTA). Percent heavy label incorporation for labeled-pairs from 13C615N2-lysine–labeled F1 generation rat ventral tegmental tissue taken at 7 weeks post weaning. These data were calculated from raw MS labeled-pair intensities (N = 297 labeled-pairs with intensity ≥ 1E5) with median %Incorporation (μ1/2) = 76.9%. Heavy label incorporation calculations predicted > 100% incorporation for 22 labeled-pairs (average: 108%), demonstrating a small contribution of error to labeled-pair ratio calculations likely from mixing and changes in isotopic distributions between heavy and light amino acid–containing peptides.
Figure 4. Orexin receptor antagonist response based on beam break behavioral data. Locomotor activity in response to orexin (Ox-B) and orexin receptor antagonist (ORA). Animals were treated with control (vehicle) or ORA at 10:30 am (as indicated, ▲) and treated with aCSF or orexin peptide at 11:30 am (as indicated, ↑). Significant ORA differences between control (vehicle) vs. Ox-B and ORA vs. Ox-B (#P value < 0.05) and between ORA vs. Ox-B and ORA vs. aCSF (*P value < 0.05) are shown.
Table 1. Regulated labeled-pairs.
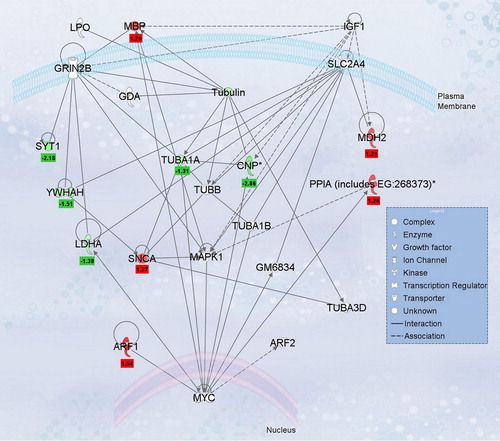
Figure 5. Ingenuity network analysis of differentially regulated labeled-pairs. proteins listed in were evaluated using Ingenuity Pathway Analysis (version 7.6) to determine interacting nodes. The top network identified was “Neurological Disease, Cell Death, Nervous System Development and Function” and is shown along with the L/H normalized ratios for each protein. Proteins with significant L/H ratios for Ox-B treatment are indicated in red and those with significant L/H ratios for antagonist treatment are shown in green, with ratios values shown below.