Figures & data
TABLE 1. Mean Scores on Descriptive Data for Children Categorized as At Risk and Typically Developing (n = 353)
TABLE 2. Factor Loadings by Item
TABLE 3. Mean Little DCDQ Scores by Group, Age, and Gender (n = 119)
TABLE 4. Discriminant Function Analysis
TABLE 5. Correlations of Little DCDQ Total and Factor Scores with the MABC-2 and Beery VMI Scores
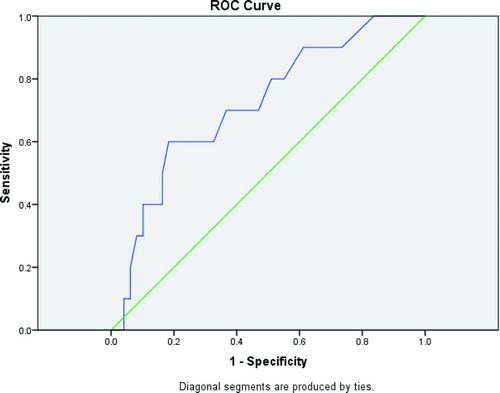
FIGURE 1. Canadian Little DCDQ: ROC curve for boys.
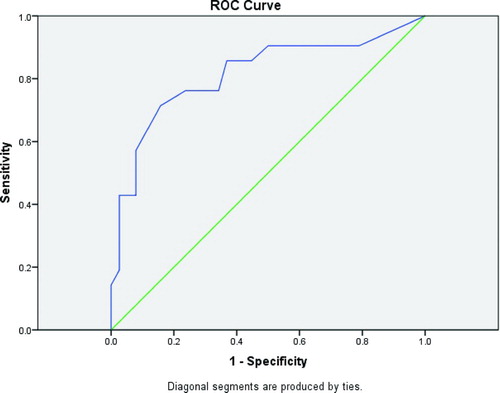
FIGURE 2. Canadian Little DCDQ ROC curve for girls.