732
Views
27
CrossRef citations to date
0
Altmetric
RESEARCH ARTICLE

Regional hyperthermia added to intensified preoperative chemo-radiation in locally advanced adenocarcinoma of middle and lower rectum

, , , , , , , & show all
Pages 108-117 | Received 20 Mar 2009, Accepted 13 Sep 2009, Published online: 10 Feb 2010

Figures & data

Table I.  Patient characteristics (n = 76).

Figure 1. Scheme of the trial.

Figure 1. Scheme of the trial.

Table II.  HT toxicity score, from B. Rau et al. Citation[29].

Table III.  CRT–related acute toxicity according to RTOG–EORTC scoring criteria Citation[35], observed in all patients (n = 76).

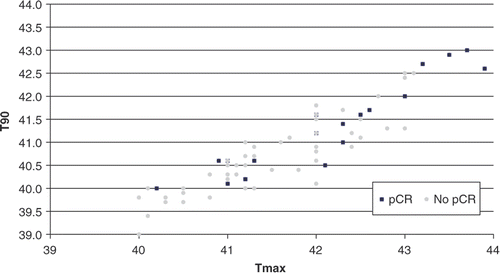
Figure 2. Tmax and T90 values in patients who underwent pCR and in those who did not (n = 76).

Figure 2. Tmax and T90 values in patients who underwent pCR and in those who did not (n = 76).

Table IV.  Clinical stage at diagnosis and subsequent pathological stage after neo–adjuvant HT plus CRT and surgery for all patients (n = 76).

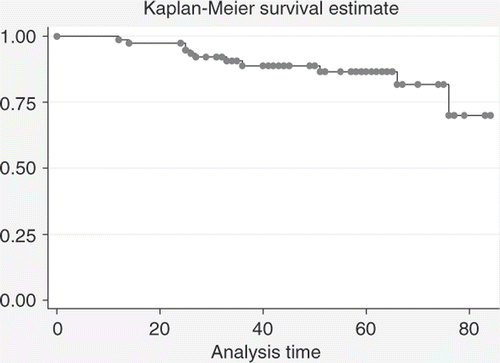
Figure 3. Kaplan-Meier OS estimates for all patients (n = 76).

Figure 3. Kaplan-Meier OS estimates for all patients (n = 76).

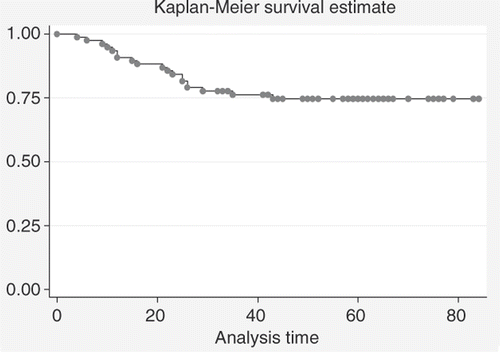
Figure 4. DFS estimates for all patients (n = 76).

Figure 4. DFS estimates for all patients (n = 76).

Figure 5. Comparison between DFS estimates for patients with ypN0 status (n = 53) and patients with ypN+ status (n = 23) (log-rank test: p = 0.0008).
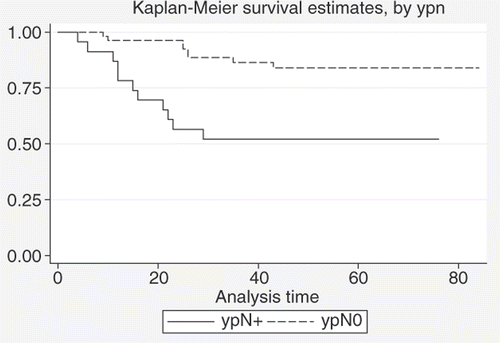
Figure 5. Comparison between DFS estimates for patients with ypN0 status (n = 53) and patients with ypN+ status (n = 23) (log-rank test: p = 0.0008).

Figure 6. Comparison between DFS estimates for patients with pCR (n = 18) and patients with no pCR (n = 58) after neoadjuvant treatment (log-rank test: p = 0.03).
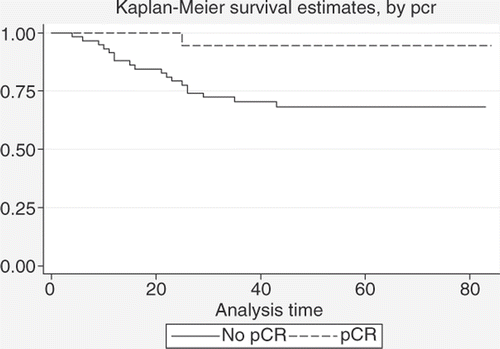
Figure 6. Comparison between DFS estimates for patients with pCR (n = 18) and patients with no pCR (n = 58) after neoadjuvant treatment (log-rank test: p = 0.03).

Figure 7. Comparison between DFS estimates for patients with ypT0-2 status (n = 53) and patients with ypT3 status (n = 23) after neoadjuvant treatment (log-rank test: p = 0.002).
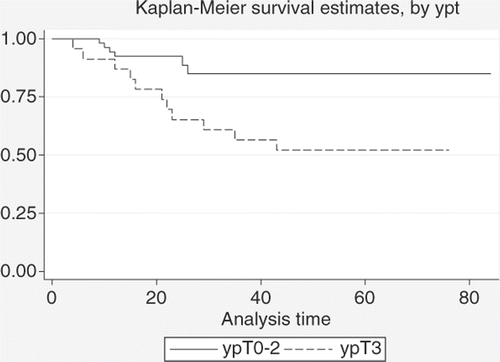
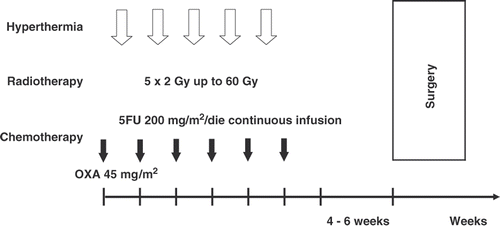
Figure 7. Comparison between DFS estimates for patients with ypT0-2 status (n = 53) and patients with ypT3 status (n = 23) after neoadjuvant treatment (log-rank test: p = 0.002).
Reprints and Corporate Permissions

Please note: Selecting permissions does not provide access to the full text of the article, please see our help page How do I view content?

To request a reprint or corporate permissions for this article, please click on the relevant link below:

Academic Permissions

Please note: Selecting permissions does not provide access to the full text of the article, please see our help page How do I view content?

Obtain permissions instantly via Rightslink by clicking on the button below:

If you are unable to obtain permissions via Rightslink, please complete and submit this Permissions form. For more information, please visit our Permissions help page.