Figures & data
Figure 1. A diagram of the transducer arrangement in the Octoson.

Figure 2. A block diagram of the equipment used in the scanned focused ultrasound hyperthermia unit.
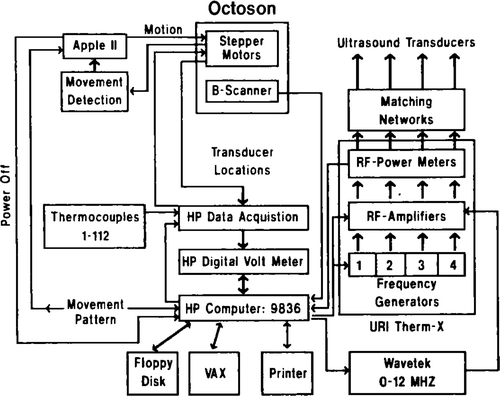
Table I. The physical characteristics of the focused ultrasonic transducers used in these studies.
Figure 3. The intensity contours in the axial plane measured in a water bath: (a) FOC 1: f = 0.5 MHz, D = 70 mm, R = 350 mm; (b) FOC 3: f = 1.0 MHz, D = 70 mm, R = 250 mm; (c) FOC 5: f = 1.0 MHz, D = 130 mm, R = 340 mm.
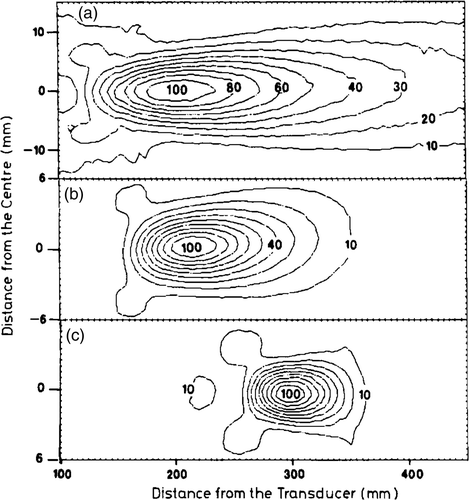
Figure 4. Examples of the different scanning patterns tested, (a) A raster scan: the number of lines and the width of each path segment can be specified independently, (b) An octagonal scan: the width and length for each octagon, the number of concentric octagons, and the number of repetitions of each octagon can be specified.
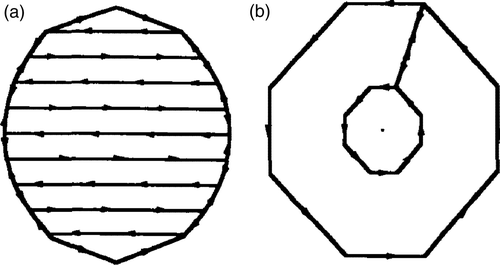
Figure 5. The temperature elevations measured in steady state in dog thigh using the small diameter transducers, (a) Two stationary transducers (FOC 3, 4), the beams overlapping at the depth of 30 mm. Total acoustical power was 15 W. (b) Two focused transducers (FOC 1, 2) scanned along two external (50 mm in diameter) and one internal (20 mm in diameter) octagons centred around the 35 mm distance position. The overlapping region was at the depth of 30 mm. Total acoustical power was 67 W. (c) Two transducers (FOC 3, 4) scanned along the same path as in . The total acoustical power was 34 W.
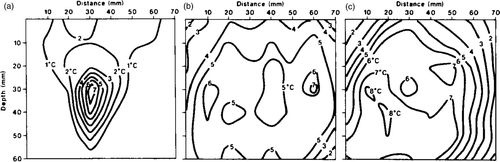
Figure 6. The isotherms measured in dog thigh using the four large focused transducers (FOC 5–8). (a) Stationary transducers focused at 100 mm depth. Total acoustic power was 7 W. The baseline temperature was 38–39°C. (b) A single 20 mm octagonal scan at a focal depth of 100 mm and centred at the 30 mm distance position. Total acoustic power was 27 W. The baseline temperature was 38–39°C. (c) A single 20 mm octagonal scan at a focal depth of 50 mm and centred at the 30 mm distance position. Total acoustic power was 22 W. The baseline temperature was 38–39°C.
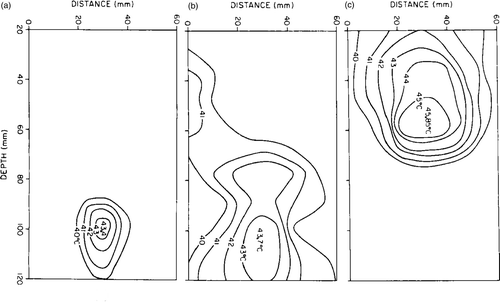
Figure 7. The temperature as a function of time in three locations in dog thigh during feedback controlled sonication. The target temperature was 43°C.
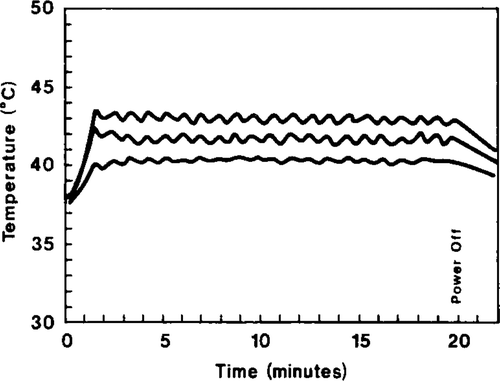
Figure 8. Diagrams illustrating the thermocouple placement in the kidney experiments. (a) For the experimental results given in and . (b) For the experimental results given in .
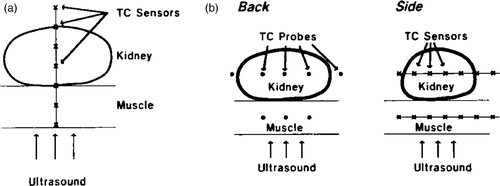
Figure 9. The steady-state temperature distributions produced with the four less highly focused transducers (FOC 1–4) along the centre of an octagonal scan 20 mm in diameter. The blood flow values to the kidney are shown in the graph. The total acoustic power was 30 W.
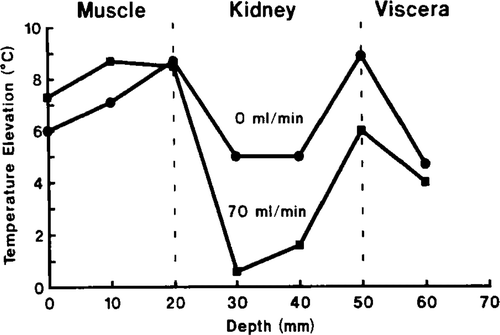
Figure 10. The same as except the sonication was done with two larger focused transducers (FOC 5, 6).
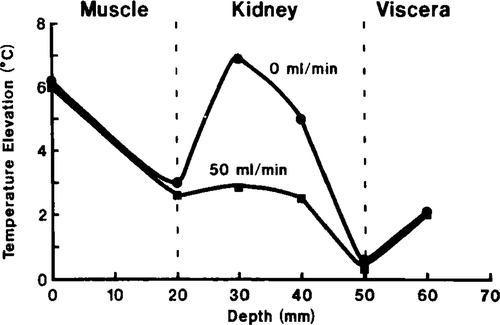
Figure 11. The average (symbol), maximum (top of bar) and the minimum (bottom of bar) measured temperatures at various positions in the muscle and kidney as a function of the blood flow to the kidney (34 g) during two external (40 mm) and one internal 20 mm scans with the four large transducers (FOC 5–8). The total acoustic power was 37 W. The number of thermocouples is given in parentheses.
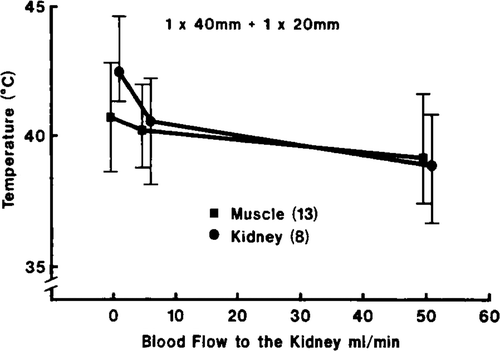
Figure 12. The same as in , but the scanning path was a single octagon 20 mm in diameter. The total acoustical power was 37 W.
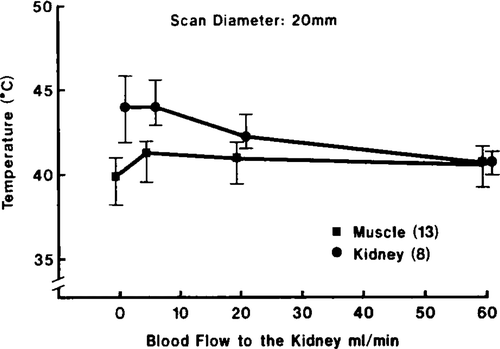
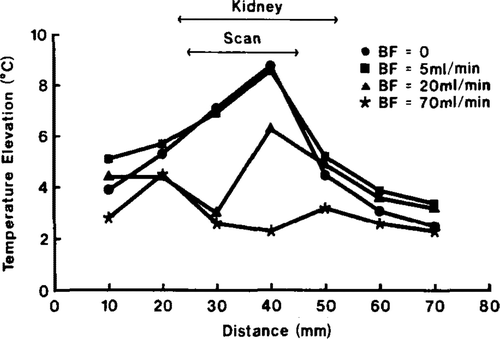
Figure 13. The steady-state temperature profile across the centre of a single 20 mm scanning path (using transducers FOC 5–8) at several flow rates into the kidney (34 g). The total acoustic power was 37 W.