Figures & data
Figure 1. Results for three synchronous, uncooled antennas, 4.2 cm (diameter) × 5.5 cm (length) ablation in ex vivo bovine liver with three antennas at 915 MHz, spaced 1.3 cm apart in triangular array (10 min, 33 W/channel, synchronous phase, no cooling).
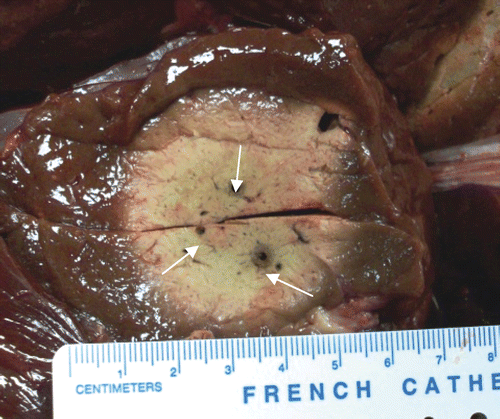
Figure 2. Results from three non-synchronous antennas, 2.5 cm (diameter) × 2.9 cm (diameter) × 6 cm (length) ablation in ex vivo bovine liver with three antennas at 915 MHz, spaced 1.3 cm in triangular array (10 min, 33 W/channel, non-synchronous phase, no cooling).
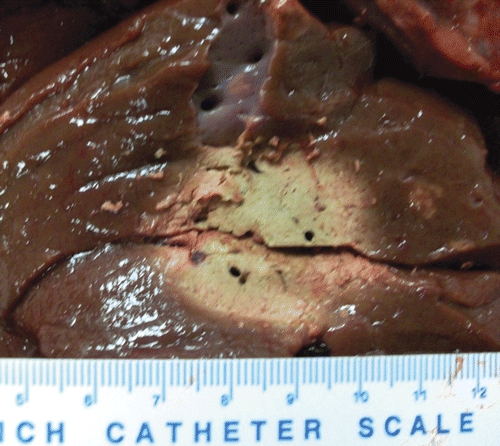
Figure 3. Single cooled antenna results, 2.9 cm (diameter) × 3 cm (diameter) × 6.1 cm (length) ablation in ex vivo bovine liver with 1 antenna at 915 MHz (10 min, 60 W, cooled antenna). A 10 mL/min flow rate was used. The left figure shows the insertion plane (arrows designate the track) and the right figure shows the perpendicular plane (arrow shows insertion).
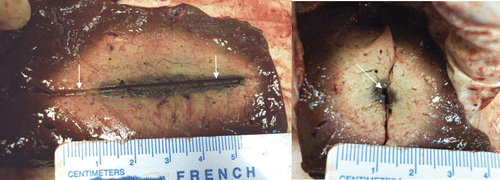
Figure 4. Dual synchronous, cooled antenna results, 4 cm (diameter) × 4.6 cm (diameter) × 5.5 cm (length) ablation in ex vivo bovine liver with two antennas (see white arrows for track indication) at 915 MHz, spaced 1.5 cm apart (10 min, 60 W/channel, synchronous phase, cooled antennas). The left figure shows the insertion plane and the right figure shows the perpendicular plane (see white arrows for antenna locations).
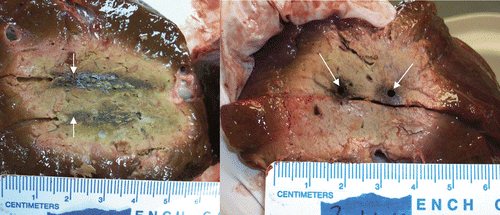
Figure 5. Triple synchronous, cooled antenna results, 5.2 cm (diameter) × 5.5 cm (diameter) × 6 cm (length) ablation in ex vivo bovine liver with three antennas at 915 MHz. (10 min, 45 W/antenna, cooled antennas). The left figure shows the insertion plane and the right figure shows the perpendicular plane. Spacing was 2.5 cm between antennas. With spacing pushed out to 3 cm (not shown) the dimensions of the volume are 5.3 cm (diameter) × 5.1 cm (diameter) × 5.1 cm (length), with some loss of volume when compared to the 2.5 cm spacing runs.
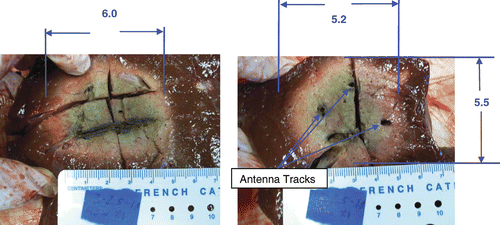
Figure 6. Triple non-synchronous, cooled antenna results. Left: spacing = 2.5 cm. Cross-section of the ablation was 4.2 cm (minimum diameter) × 4.5 cm (diameter) × 5.4 cm (length) (10 min, 45 W/channel, non-synchronous phase, cooled antennas). There are treatment gaps of viable tissue between antennas where the ablation lacks sphericity. Right: spacing = 3 cm. Cross-section of the ablation was 3.6 cm (minimum diameter) × 4.5 cm (diameter) × 5 cm (length) (10 min, 45 W/channel, non-synchronous phase, cooled antennas). The treatment gaps are even larger when the antenna spacing is increased.
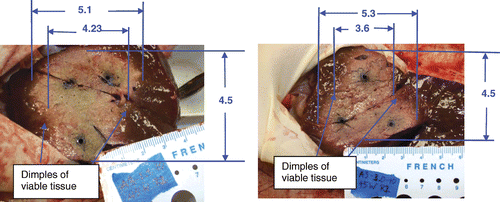
Table I. Transition from hyperthermia to ablation with interstitial MW antennas.
Table II. Summary of the experimental data with synchronous (S) and non-synchronous (NS) denoted. Synchronous runs showed larger volumes and higher efficiency ratios, denoting a larger volume for the same energy input. L1 and L2 are the two diameters, perpendicular to the insertion of the antennas. L3 is the length in the direction of insertion of the array.
Figure 7. Ablation shape scale definition for the plane perpendicular to the insertion axis (left) and parallel to the insertion axis (right).
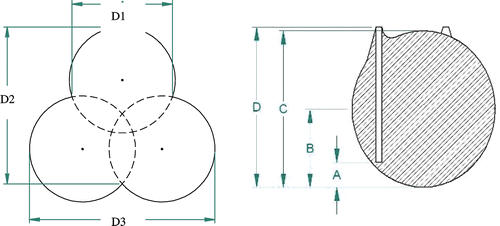
Table III. Detailed comparison between the largest spacing of 2.5 and 3 cm (relating to and ) runs with three antennas in a triangular configuration. The synchronous runs had no D2 measurements since they were more spherical. In addition, the synchronous runs had no D values since the peak was central, not located in the vicinity of the antenna shafts.
Figure 8. Three antenna simulations: synchronous versus non-synchronous. (A) The predicted SAR pattern with three synchronous antennas (see arrow) spaced 2.2 cm on a side with triangular cross section. (B) The predicted SAR pattern with three non-synchronous antennas (see arrow) spaced 2.2 cm on a side with triangular cross section.
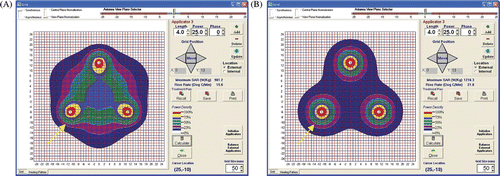
Figure 9. Four antenna simulations: synchronous versus non-synchronous. (A) The predicted SAR pattern with four synchronous antennas (see arrow) spaced 2.4 cm on a side with square cross-section. (B) The predicted SAR pattern with four non-synchronous antennas (see arrow) spaced 2.4 cm on a side with square cross-section.
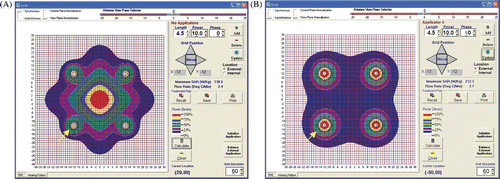
Table IV. Steps in the transition from hyperthermia (HT) to thermal ablation (TA).