565
Views
9
CrossRef citations to date
0
Altmetric
Research Article

Hyperthermia-induced apoptosis in Tca8113 cells is inhibited by heat shock protein 27 through blocking phospholipid scramblase 3 phosphorylation

, , , , &
Pages 523-537 | Received 20 May 2009, Accepted 20 Mar 2010, Published online: 22 Jun 2010

Figures & data

Figure 1. Analysis of apoptosis and mitochondrial CL distribution in parents Tca8113 cells. (A) The parents cells were heated at 43°C for 20 min, 40 min, 60 min, and then incubated at 37°C for 4 h. Cells were stained with different concentrations of NAO, and the median fluorescence intensity at 640 nm was determined by flow cytometry. The median fluorescence intensity value at the first site of plateaus represented saturation of the amount of CL in the outer leaflet of mitochondrial outer membrane (↓ point in the figure).The median fluorescence intensity value of 35 µM NAO was considered to be 100% and used to calculate the percentage in first saturated site NAO concentration. (B) The parents Tca8113 cells were heated at 43°C for 20 min, 40 min, and 60 min, and then cultured at 37°C for 24 h. The apoptotic cells were determined by flow cytometry. Columns, mean from three independent experiments. Bars, ±SD.
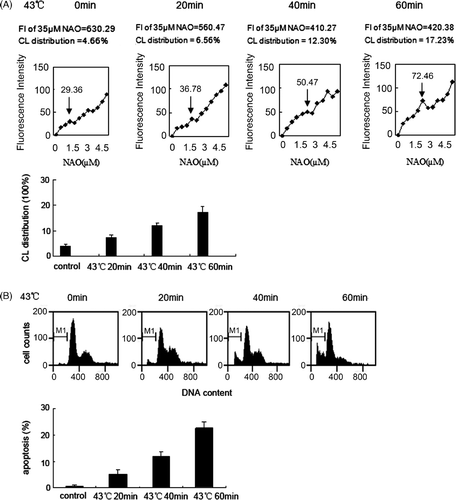
Figure 1. Analysis of apoptosis and mitochondrial CL distribution in parents Tca8113 cells. (A) The parents cells were heated at 43°C for 20 min, 40 min, 60 min, and then incubated at 37°C for 4 h. Cells were stained with different concentrations of NAO, and the median fluorescence intensity at 640 nm was determined by flow cytometry. The median fluorescence intensity value at the first site of plateaus represented saturation of the amount of CL in the outer leaflet of mitochondrial outer membrane (↓ point in the figure).The median fluorescence intensity value of 35 µM NAO was considered to be 100% and used to calculate the percentage in first saturated site NAO concentration. (B) The parents Tca8113 cells were heated at 43°C for 20 min, 40 min, and 60 min, and then cultured at 37°C for 24 h. The apoptotic cells were determined by flow cytometry. Columns, mean from three independent experiments. Bars, ±SD.

Figure 2. Tca8113 cells were transfected with the control, wild-type PLS3, and mutant PLS3 (T21A) plasmids for 24 h, respectively. Western blotting showed comparable expression of PLS3 in Tca8113- PLS3 cells and Tca8113-PLS3 (T21A) cells.
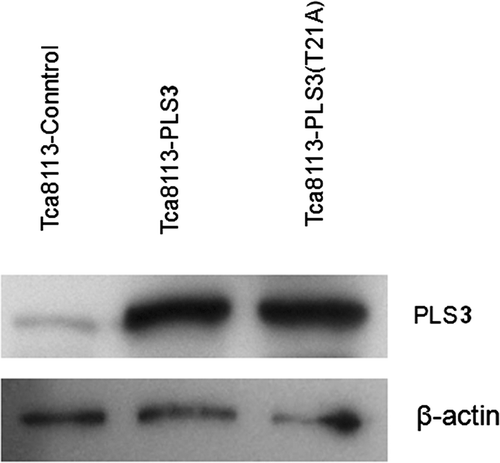
Figure 2. Tca8113 cells were transfected with the control, wild-type PLS3, and mutant PLS3 (T21A) plasmids for 24 h, respectively. Western blotting showed comparable expression of PLS3 in Tca8113- PLS3 cells and Tca8113-PLS3 (T21A) cells.

Figure 3. Wild-type PLS3 facilitates heat-induced mitochondrial CL translocation. Tca8113 cells were transfected with the control, wild-type PLS3, and mutant PLS3 (T21A) plasmids for 24 h, respectively. The transfected cells were heated at 43°C for 40 min and then incubated at 37°C for 4 h. Cells were harvested and stained with different concentrations of NAO, and the median fluorescence intensity at 640 nm was determined by flow cytometry. ↓ represent the same means as in . The median fluorescence intensity value of 35 µM NAO was considered to be 100% and used to calculate the percentage in first saturated site NAO concentration. Columns, mean from three independent experiments. Bars, ±SD. *p < 0.01.
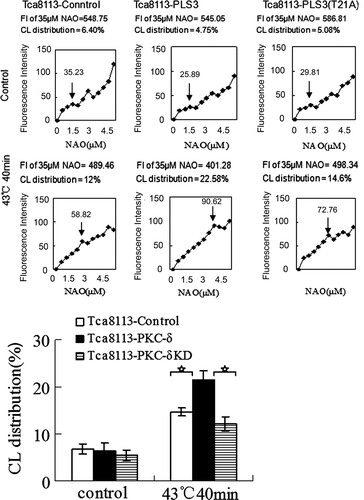
Figure 3. Wild-type PLS3 facilitates heat-induced mitochondrial CL translocation. Tca8113 cells were transfected with the control, wild-type PLS3, and mutant PLS3 (T21A) plasmids for 24 h, respectively. The transfected cells were heated at 43°C for 40 min and then incubated at 37°C for 4 h. Cells were harvested and stained with different concentrations of NAO, and the median fluorescence intensity at 640 nm was determined by flow cytometry. ↓ represent the same means as in Figure 1A. The median fluorescence intensity value of 35 µM NAO was considered to be 100% and used to calculate the percentage in first saturated site NAO concentration. Columns, mean from three independent experiments. Bars, ±SD. *p < 0.01.

Table I.  Redistribution of CL in PLS3- transfected cell groups (%).

Figure 4. Wild-type PLS3 promotes heat-induced apoptosis. The control, wild-type PLS3, and mutant PLS3 (T21A) plasmids transfected Tca8113 cells were heated at 43°C for 20 min, 40 min, and 60 min, and harvested for apoptosis assays by flow cytometry after cells being cultured at 37°C for 24 h. The apoptotic population was determined by propidium iodide staining. The sub-G1 population was marked by M1 gate and used to represent the apoptotic population. Columns, mean from three independent experiments. Bars, ±SD. *p < 0.01.
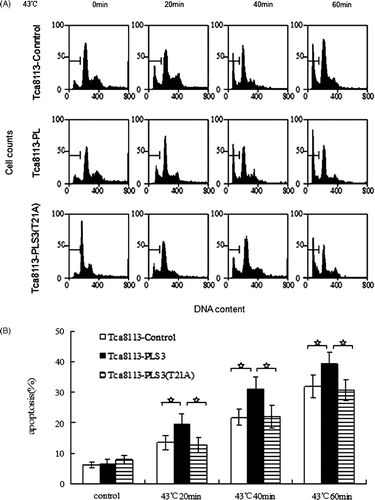
Figure 4. Wild-type PLS3 promotes heat-induced apoptosis. The control, wild-type PLS3, and mutant PLS3 (T21A) plasmids transfected Tca8113 cells were heated at 43°C for 20 min, 40 min, and 60 min, and harvested for apoptosis assays by flow cytometry after cells being cultured at 37°C for 24 h. The apoptotic population was determined by propidium iodide staining. The sub-G1 population was marked by M1 gate and used to represent the apoptotic population. Columns, mean from three independent experiments. Bars, ±SD. *p < 0.01.

Table II.  Apoptosis in of PLS3- transfected cell groups (%).

Figure 5. Heat-induced phosphorylation of PLS3. The Tca8113-PLS3 and Tca8113-PLS3 (T21A) transfected cells were heat shocked for 40 min and returned to 37°C. PLS3 was extracted from the cell lysate of transfected cells after 2 h, 4 h, and 6 h at 37°C for western blotting assays. Immunoblot analysis shows an increase in phosphorylation level of PLS3 with increasing time at 37°C following heat shock of Tca8113-PLS3 cells, but no change was observed following heat shock of Tca8113-PLS3 (T21A) cells.

Figure 5. Heat-induced phosphorylation of PLS3. The Tca8113-PLS3 and Tca8113-PLS3 (T21A) transfected cells were heat shocked for 40 min and returned to 37°C. PLS3 was extracted from the cell lysate of transfected cells after 2 h, 4 h, and 6 h at 37°C for western blotting assays. Immunoblot analysis shows an increase in phosphorylation level of PLS3 with increasing time at 37°C following heat shock of Tca8113-PLS3 cells, but no change was observed following heat shock of Tca8113-PLS3 (T21A) cells.

Figure 6. Tca8113 cells were transfected with the control, wild-type PKC-δ, and PKC-δ-KD plasmids for 24 h, respectively. Western blotting showed comparable expression of PLS3 in Tca8113- PLS3 cells and Tca8113-PLS3 (T21A) cells.
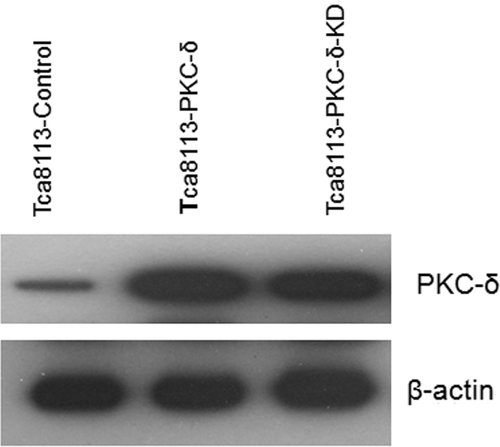
Figure 6. Tca8113 cells were transfected with the control, wild-type PKC-δ, and PKC-δ-KD plasmids for 24 h, respectively. Western blotting showed comparable expression of PLS3 in Tca8113- PLS3 cells and Tca8113-PLS3 (T21A) cells.

Figure 7. Wild-type PKC-δ facilitates hyperthermia-induced mitochondrial CL translocation. The control, PKC-δ, and PKC-δ-KD plasmids transfected cells were heated at 43°C for 40 min, and then harvested and stained with different concentrations of NAO after cells being incubated at 37°C for 4 h. The median fluorescence intensity at 640 nm was determined by flow cytometry. ↓ represent the same means as in . The median fluorescence intensity value of 35 µM NAO was considered to be 100% and used to calculate the percentage in first saturated site NAO concentration. Columns, mean from three independent experiments. Bars, ±SD. *p < 0.01.
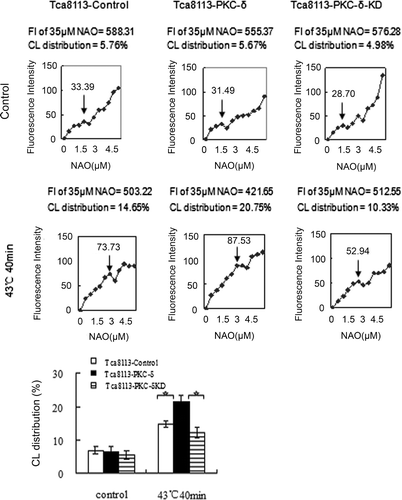
Figure 7. Wild-type PKC-δ facilitates hyperthermia-induced mitochondrial CL translocation. The control, PKC-δ, and PKC-δ-KD plasmids transfected cells were heated at 43°C for 40 min, and then harvested and stained with different concentrations of NAO after cells being incubated at 37°C for 4 h. The median fluorescence intensity at 640 nm was determined by flow cytometry. ↓ represent the same means as in Figure 1A. The median fluorescence intensity value of 35 µM NAO was considered to be 100% and used to calculate the percentage in first saturated site NAO concentration. Columns, mean from three independent experiments. Bars, ±SD. *p < 0.01.

Table III.  Redistribution of CL in PKC-δ- transfected cell groups (%).

Figure 8. Wild-type PKC-δ facilitates hyperthermia-induced apoptosis. The three transfected Tca8113 cells were heated at 43°C for 40 min, and harvested for apoptosis assays by flow cytometry after cells being cultured at 37°C for 24 h. The apoptotic population was determined by propidium iodide staining. The sub-G1 population was marked by M1 gate and used to represent the apoptotic population. Columns, mean from three independent experiments. Bars, ±SD. *p < 0.01.
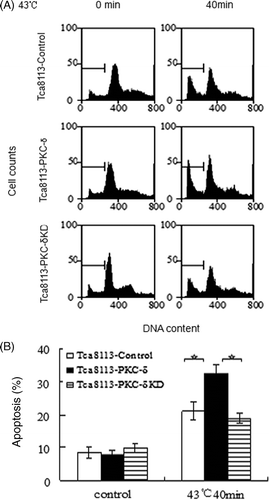
Figure 8. Wild-type PKC-δ facilitates hyperthermia-induced apoptosis. The three transfected Tca8113 cells were heated at 43°C for 40 min, and harvested for apoptosis assays by flow cytometry after cells being cultured at 37°C for 24 h. The apoptotic population was determined by propidium iodide staining. The sub-G1 population was marked by M1 gate and used to represent the apoptotic population. Columns, mean from three independent experiments. Bars, ±SD. *p < 0.01.

Table IV.  Apoptosis in PKC-δ- transfected cell groups (%).

Figure 9. Heat enhances phosphorylation of PLS3 by PKC-δ. The Tca8113 cells were co-transfected with wild-type PLS3 plasmid and the control, wild-type PKC-δ or PKC-δ-KD plasmid for 24 h, respectively. The co-transfected cells were heated at 43°C for 40 min and then cultured at 37°C for 4 h, whole cell lysates were incubated with Ni beads to pull down His-tagged PLS3, and analysed with the antibodies against phosphothreonine and PLS3. PKC-δ was immunoprecipitated from whole cell lysates and analysed with antibodies against PKC-δ and PLS3. The interaction of PLS3/PKC-δ was enhanced by elevated PKC-δ expression, but no PLS3/PKC-δ interaction was observed with the PKC-δ-KD.
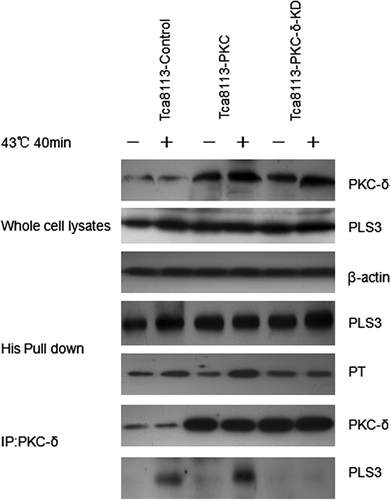
Figure 9. Heat enhances phosphorylation of PLS3 by PKC-δ. The Tca8113 cells were co-transfected with wild-type PLS3 plasmid and the control, wild-type PKC-δ or PKC-δ-KD plasmid for 24 h, respectively. The co-transfected cells were heated at 43°C for 40 min and then cultured at 37°C for 4 h, whole cell lysates were incubated with Ni beads to pull down His-tagged PLS3, and analysed with the antibodies against phosphothreonine and PLS3. PKC-δ was immunoprecipitated from whole cell lysates and analysed with antibodies against PKC-δ and PLS3. The interaction of PLS3/PKC-δ was enhanced by elevated PKC-δ expression, but no PLS3/PKC-δ interaction was observed with the PKC-δ-KD.

Figure 10. Tca8113 cells were transfected with the control, Hsp27 plasmids for 24 h, respectively. Western blotting showed elevated and stable expression of Hsp27 in Tca8113-Hsp27 cells.
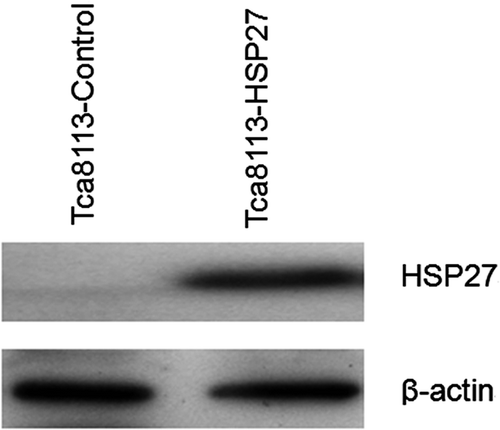
Figure 10. Tca8113 cells were transfected with the control, Hsp27 plasmids for 24 h, respectively. Western blotting showed elevated and stable expression of Hsp27 in Tca8113-Hsp27 cells.

Figure 11. Hsp27 decreases outer mitochondrial CL distribution. Tca8113 cells were transfected with the control and Hsp27 plasmids for 24 h, and harvested and stained with different concentrations of NAO after cells being incubated at 37°C for 4 h. The median fluorescence intensity at 640 nm was determined by flow cytometry. ↓ represent the same means as in . The median fluorescence intensity value of 35 μM NAO was considered to be 100% and used to calculate the percentage in first saturated site NAO concentration. Columns, mean from three independent experiments. Bars, ±SD. **p < 0.05.
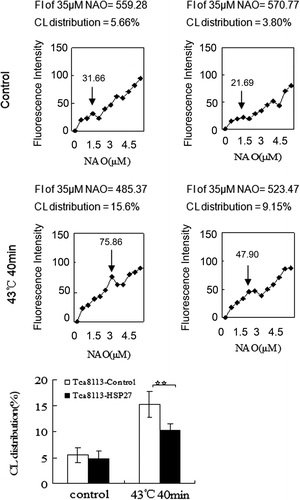
Figure 11. Hsp27 decreases outer mitochondrial CL distribution. Tca8113 cells were transfected with the control and Hsp27 plasmids for 24 h, and harvested and stained with different concentrations of NAO after cells being incubated at 37°C for 4 h. The median fluorescence intensity at 640 nm was determined by flow cytometry. ↓ represent the same means as in Figure 1A. The median fluorescence intensity value of 35 μM NAO was considered to be 100% and used to calculate the percentage in first saturated site NAO concentration. Columns, mean from three independent experiments. Bars, ±SD. **p < 0.05.

Figure 12. Hsp27 suppresses heat-induced apoptosis. The control and Hsp27 plasmids transfected Tca8113 cells were heated at 43°C for 40 min, and harvested for apoptosis assays by flow cytometry after cells being cultured at 37°C for 24 h. The apoptotic population was determined by propidium iodide staining. The sub-G1 population was marked by M1 gate and used to represent the apoptotic population. Columns, mean from three independent experiments. Bars, SD. **p < 0.05.
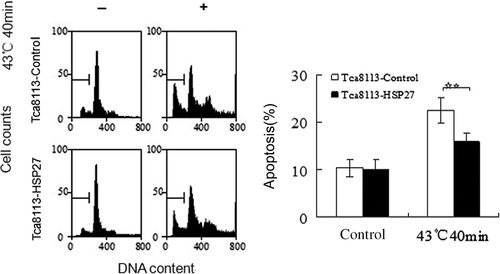
Figure 12. Hsp27 suppresses heat-induced apoptosis. The control and Hsp27 plasmids transfected Tca8113 cells were heated at 43°C for 40 min, and harvested for apoptosis assays by flow cytometry after cells being cultured at 37°C for 24 h. The apoptotic population was determined by propidium iodide staining. The sub-G1 population was marked by M1 gate and used to represent the apoptotic population. Columns, mean from three independent experiments. Bars, SD. **p < 0.05.

Table V.  Redistribution of CL in Hsp27- transfected cell groups (%).

Table VI.  Apoptosis in Hsp27- transfected cells groups (%).

Figure 13. Hsp27 suppresses the interaction between PKC-δ and PLS3. The Tca8113 cells were co-transfected with the control or Hsp27 plasmids and the PLS3 plasmid for 24 h respectively. The co-transfected cells were heated at 43°C for 40 min and then cultured at 37°C for 4 h, whole cell lysates were incubated with Ni beads to pull down His-tagged PLS3, and analysed with the antibodies against phosphothreonine and PLS3 by western blotting. PKC-δ was immunoprecipitated from whole cell lysates and analysed with antibodies against PKC-δ and PLS3 by western blotting. Western blotting assay showed Hsp27 blocked the PLS3/PKC-δ interaction and decreased the phosphorylation level of PLS3.
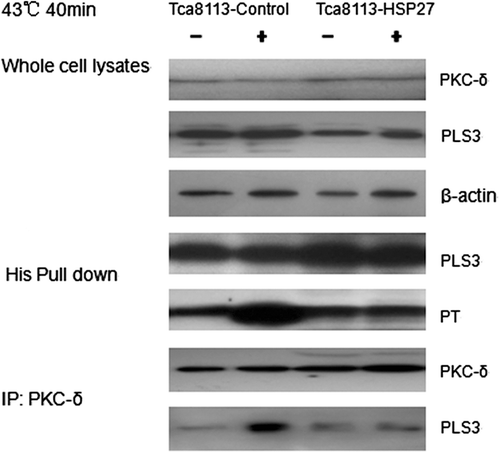
Figure 13. Hsp27 suppresses the interaction between PKC-δ and PLS3. The Tca8113 cells were co-transfected with the control or Hsp27 plasmids and the PLS3 plasmid for 24 h respectively. The co-transfected cells were heated at 43°C for 40 min and then cultured at 37°C for 4 h, whole cell lysates were incubated with Ni beads to pull down His-tagged PLS3, and analysed with the antibodies against phosphothreonine and PLS3 by western blotting. PKC-δ was immunoprecipitated from whole cell lysates and analysed with antibodies against PKC-δ and PLS3 by western blotting. Western blotting assay showed Hsp27 blocked the PLS3/PKC-δ interaction and decreased the phosphorylation level of PLS3.

Reprints and Corporate Permissions

Please note: Selecting permissions does not provide access to the full text of the article, please see our help page How do I view content?

To request a reprint or corporate permissions for this article, please click on the relevant link below:

Academic Permissions

Please note: Selecting permissions does not provide access to the full text of the article, please see our help page How do I view content?

Obtain permissions instantly via Rightslink by clicking on the button below:

If you are unable to obtain permissions via Rightslink, please complete and submit this Permissions form. For more information, please visit our Permissions help page.