Figures & data
Figure 1. The effects of TNF-α, hyperthermia and their combination treatments on cell viability detected by trypan blue exclusion method. The treated cells were harvested at different times after the treatments and the number of viable cells was counted. TNF-α concentration was 5 ng/mL, and it remained in the medium until the cells were harvested; H: cells were incubated at 43°C for 1 h; T + H: TNF-α was added 1h before heating; H + T: TNF was added after heating 43°C for 1 h. The data presented are the mean and standard deviation of three independent determinations. (A) L929 cells, (B) rL929 cells.
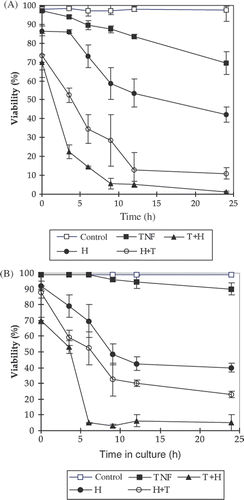
Figure 2. The kinetics of apoptosis induced by TNF-α, hyperthermia and their combination treatments on L929 and rL929 cells. The percentage of apoptosis induced by different treatments was detected by flow cytometer after staining DNA in single cell with propidium iodine (PI). The procedures of different treatments including TNF-α, H, T + H and H + T are the same as in . The data presented are the mean and standard deviation of three independent determinations. (A) L929 cells, (B) rL929 cells.
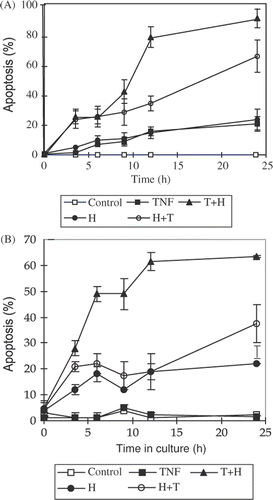
Figure 3. Examples of DNA fragmentation shown on agarose gel electrophoresis after (A) heat treatment and (B) TNF-α treatment in L929 cells. Lane 1: 100 bp marker, lanes 2-8 represent control, 0 h,3.5 h, 6 h, 9 h, 12 h, 24 h after the treatment, respectively. The data are representatives of three independent experiments.
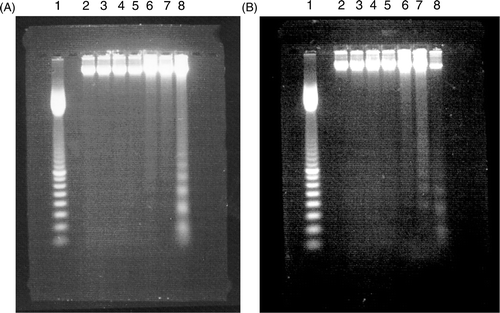
Figure 4. Examples of DNA fragmentation shown on agarose gel electrophoresis after (A) H + T treatment and (B) T + H treatment in L929 cells. Lane 1: 100 bp marker, lanes 2-9 represent control, 0 h, 3.5 h, 6 h, 9 h, 12 h, 24 h after the treatment, respectively. The data are representatives of three independent experiments.
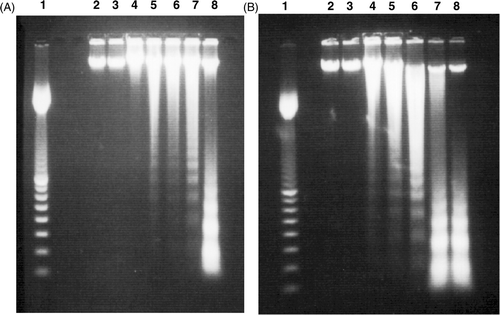
Figure 5. Example of DNA fragmentation shown on agarose gel electrophoresis after different treatments in rL929 cells. Lane 1: 100 bp marker, lanes 2–5 represent 6 h, 9 h, 12 h, 24 h after the heating treatment, respectively. Lanes 6–9 represent 6 h, 9 h, 12 h, 24 h after the H + T treatment, respectively. Lanes 10–13 represent 6 h, 9 h, 12 h, 24 h after the T + H treatment, respectively. The data are representatives of three independent experiments.
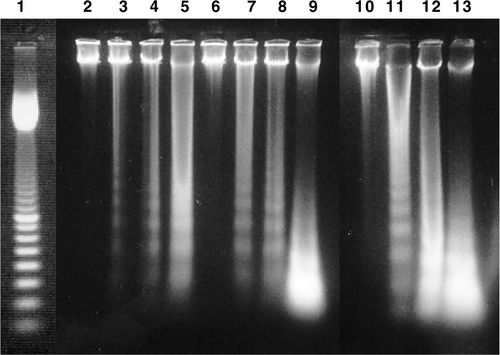
Table I. Grading of regional toxicity according to Weiberdink et al. Citation[45].