855
Views
30
CrossRef citations to date
0
Altmetric
RESEARCH ARTICLE

Improved hyperthermia treatment control using SAR/temperature simulation and PRFS magnetic resonance thermal imaging

, , , , , , , , & show all
Pages 86-99 | Received 09 Jun 2009, Accepted 12 Jun 2010, Published online: 11 Nov 2010

Figures & data

Figure 1. A schematic diagram of the mini-annular phased array (MAPA) applicator. Each antenna pair is fed by a coaxial cable (RG-233/U) at the centre of the U-shaped elements and each cable has a coaxial stub tuner for impedance matching.
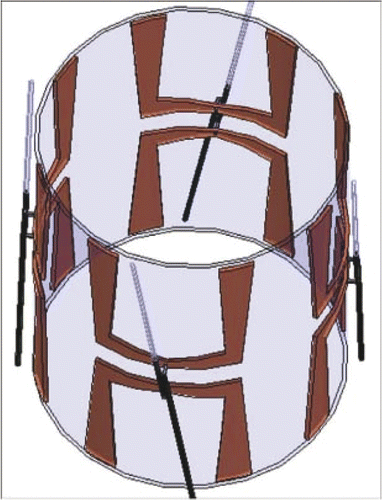
Figure 1. A schematic diagram of the mini-annular phased array (MAPA) applicator. Each antenna pair is fed by a coaxial cable (RG-233/U) at the centre of the U-shaped elements and each cable has a coaxial stub tuner for impedance matching.

Figure 2. MRI cross-section of patient's lower leg inside 4 antenna MAPA applicator.

Figure 2. MRI cross-section of patient's lower leg inside 4 antenna MAPA applicator.

Figure 3. A muscle tissue phantom in the MAPA phased array applicator surrounded by water. Dark spots inside the room temperature gel phantom are caused by small air inclusions.
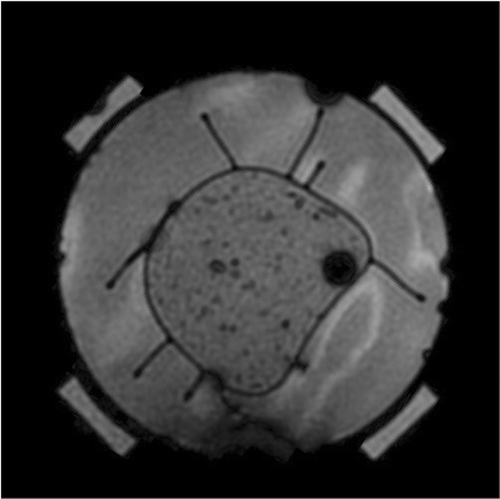
Figure 3. A muscle tissue phantom in the MAPA phased array applicator surrounded by water. Dark spots inside the room temperature gel phantom are caused by small air inclusions.

Figure 4. An anatomical reconstruction of a patient's leg with a patient-specific sarcoma inserted inside a generic patient lower leg.
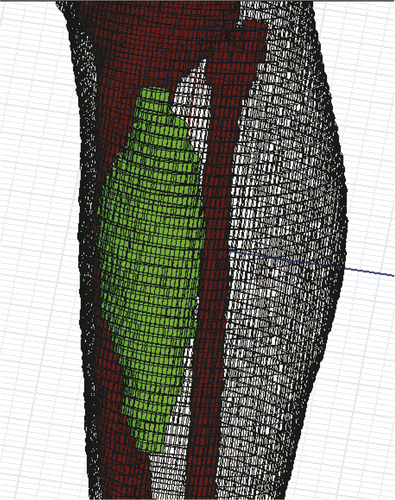
Figure 4. An anatomical reconstruction of a patient's leg with a patient-specific sarcoma inserted inside a generic patient lower leg.

Figure 5. The patient specific tumour has been inserted in the correct location in the generic patient leg model, and the leg is placed inside the MAPA heat applicator.
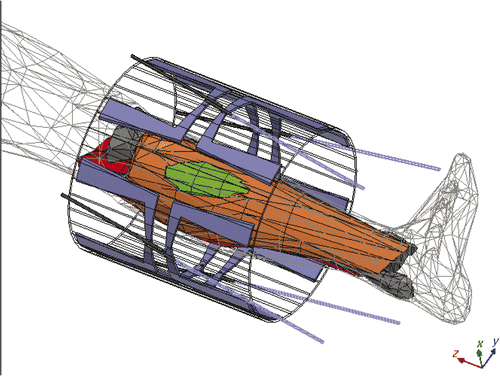
Figure 5. The patient specific tumour has been inserted in the correct location in the generic patient leg model, and the leg is placed inside the MAPA heat applicator.

Figure 6. A schematic diagram in HFSS of a human body being placed inside the MR with leg tumour inside an annular phased array limb applicator. All cables which feed the antennas and their tuning stubs are included in the complete model for the initial simulation to verify accuracy of the smaller model for subsequent studies.
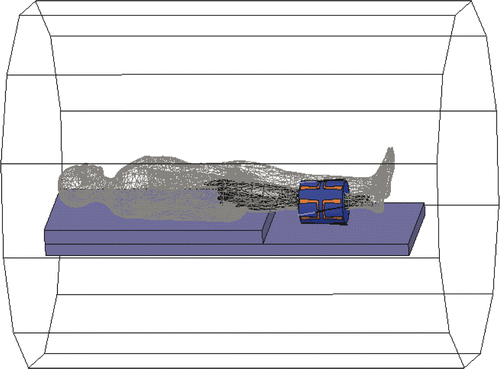
Figure 6. A schematic diagram in HFSS of a human body being placed inside the MR with leg tumour inside an annular phased array limb applicator. All cables which feed the antennas and their tuning stubs are included in the complete model for the initial simulation to verify accuracy of the smaller model for subsequent studies.

Table I.  Material properties used in the thermodynamic simulation Citation[50–52].

Figure 7. HFSS simulation results in the x-y plane (x, horizontal; y, vertical) for four different combinations of relative phase of the four MAPA antennas which produce movement of the SAR peak either horizontally to the right or diagonally towards lower left. Higher SAR is shown in orange. Relative phases are labelled at the top.
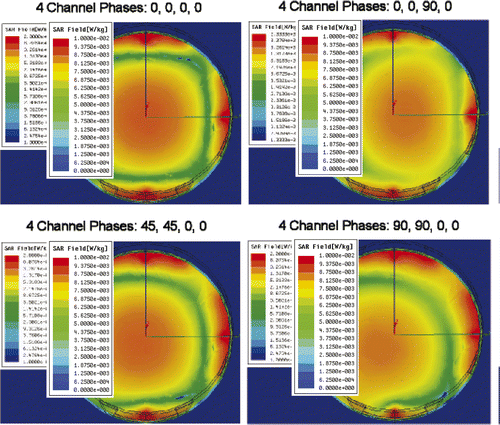
Figure 7. HFSS simulation results in the x-y plane (x, horizontal; y, vertical) for four different combinations of relative phase of the four MAPA antennas which produce movement of the SAR peak either horizontally to the right or diagonally towards lower left. Higher SAR is shown in orange. Relative phases are labelled at the top.

Figure 8. Peak SAR region in the x-y plane for four different combinations of relative phase of the four MAPA antenna pairs which move the peak SAR either horizontally to the right or diagonally towards the lower left. Relative phases are labelled at the top.
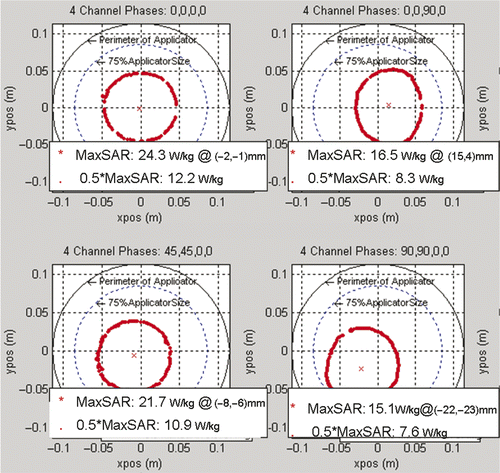
Figure 8. Peak SAR region in the x-y plane for four different combinations of relative phase of the four MAPA antenna pairs which move the peak SAR either horizontally to the right or diagonally towards the lower left. Relative phases are labelled at the top.

Figure 9. Shifting of temperature rise within the phantom as measured by MRTI for four different antenna phase set-ups. Note the visual correlation of MR measured shift of focal heating with the theoretical simulations of and . 120 mm diameter phantom outline shown in blue.
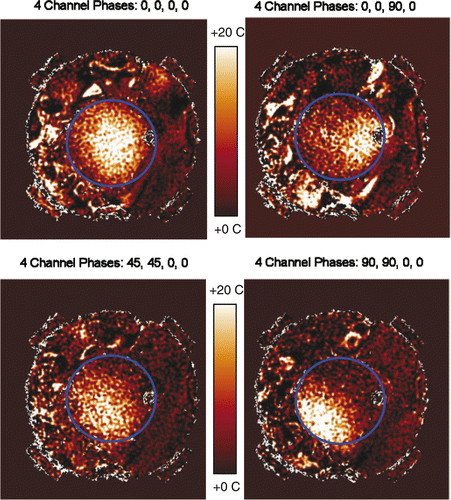
Figure 9. Shifting of temperature rise within the phantom as measured by MRTI for four different antenna phase set-ups. Note the visual correlation of MR measured shift of focal heating with the theoretical simulations of Figures 7 and 8. 120 mm diameter phantom outline shown in blue.

Figure 10. Dosimetry of a clinical hyperthermia treatment of an advanced fibrous histiocytoma (soft-tissue sarcoma) tumour in the lower leg. (A) Anatomic MRI of patient's lower leg inside MAPA applicator with 4 dipole antenna pairs and 4 silicon oil reference tubes. (B) Temperature as a function of time. (C) Baseline temperature change map after 4 min of imaging without heat – temperatures in the leg are stable; (D) Temperature change map at approximately 18 min into treatment – although tumour is heating, excessive heat is seen in normal tissue on the opposite side of leg; (E) 25 min into treatment after adjusting antenna phases to focus heat primarily in the tumour region at the upper right.
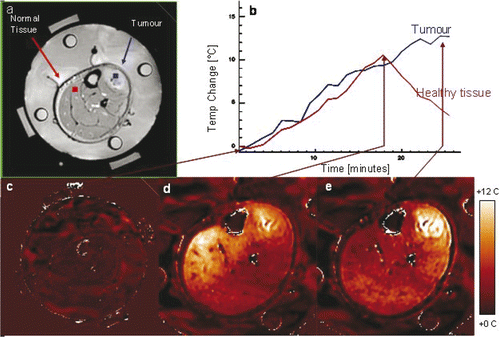
Figure 10. Dosimetry of a clinical hyperthermia treatment of an advanced fibrous histiocytoma (soft-tissue sarcoma) tumour in the lower leg. (A) Anatomic MRI of patient's lower leg inside MAPA applicator with 4 dipole antenna pairs and 4 silicon oil reference tubes. (B) Temperature as a function of time. (C) Baseline temperature change map after 4 min of imaging without heat – temperatures in the leg are stable; (D) Temperature change map at approximately 18 min into treatment – although tumour is heating, excessive heat is seen in normal tissue on the opposite side of leg; (E) 25 min into treatment after adjusting antenna phases to focus heat primarily in the tumour region at the upper right.

Figure 11. Simulated temperature distributions for a hyperthermia treatment of the human sarcoma shown in . A) Predicted temperature distribution for the leg at approximately 18 minutes into treatment using equal phase and amplitude excitation, heat is focused in the low perfusion tumour region but also heats normal tissue on the left side of the leg; B) temperature distribution for the leg predicted for 25 min into treatment after adjusting antenna phase to the simulated optimal values, heat is focused primarily in the tumour region in the upper right of the leg.
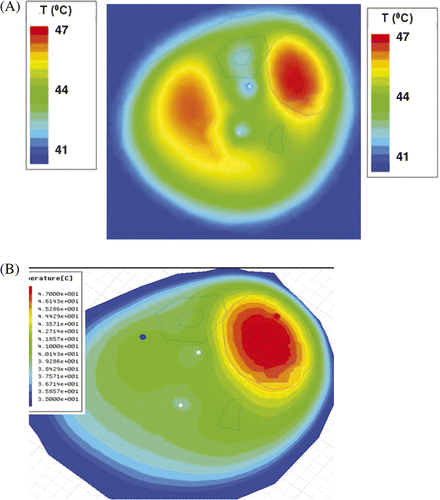
Figure 11. Simulated temperature distributions for a hyperthermia treatment of the human sarcoma shown in Figure 10. A) Predicted temperature distribution for the leg at approximately 18 minutes into treatment using equal phase and amplitude excitation, heat is focused in the low perfusion tumour region but also heats normal tissue on the left side of the leg; B) temperature distribution for the leg predicted for 25 min into treatment after adjusting antenna phase to the simulated optimal values, heat is focused primarily in the tumour region in the upper right of the leg.

Figure 12. E-field distribution when phases of each antenna are optimised: Antenna 1, 0°; Antenna 2, 70°; Antenna 3, 95°; and Antenna 4, 5°.
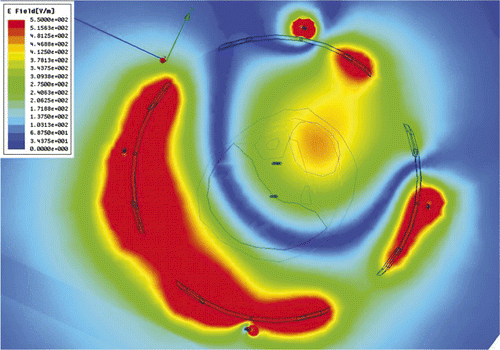
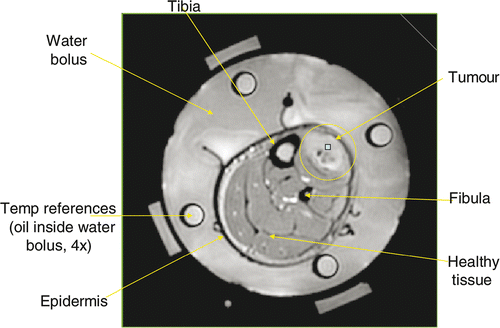
Figure 12. E-field distribution when phases of each antenna are optimised: Antenna 1, 0°; Antenna 2, 70°; Antenna 3, 95°; and Antenna 4, 5°.
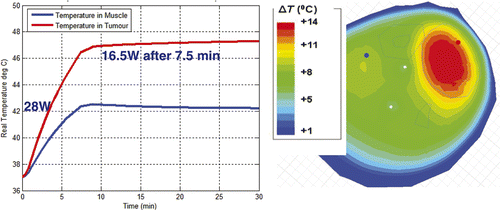
Figure 13. Simulated temperature in tumour and muscle with phase adjusted experimentally for focused heat in leg tumour: Antenna 1, 0°; Antenna 2, 30°;Antenna 3, 60°; and Antenna 4, 0°.

Figure 13. Simulated temperature in tumour and muscle with phase adjusted experimentally for focused heat in leg tumour: Antenna 1, 0°; Antenna 2, 30°;Antenna 3, 60°; and Antenna 4, 0°.

Figure 14. Simulated temperature in tumour and muscle with phase optimised with HFSS: Antenna 1, 0°; Antenna 2, 70°; Antenna 3, 95°; and Antenna 4, 5°.
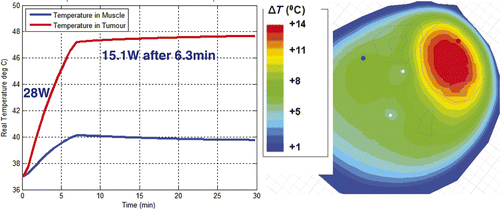
Figure 14. Simulated temperature in tumour and muscle with phase optimised with HFSS: Antenna 1, 0°; Antenna 2, 70°; Antenna 3, 95°; and Antenna 4, 5°.

Reprints and Corporate Permissions

Please note: Selecting permissions does not provide access to the full text of the article, please see our help page How do I view content?

To request a reprint or corporate permissions for this article, please click on the relevant link below:

Academic Permissions

Please note: Selecting permissions does not provide access to the full text of the article, please see our help page How do I view content?

Obtain permissions instantly via Rightslink by clicking on the button below:

If you are unable to obtain permissions via Rightslink, please complete and submit this Permissions form. For more information, please visit our Permissions help page.