Figures & data
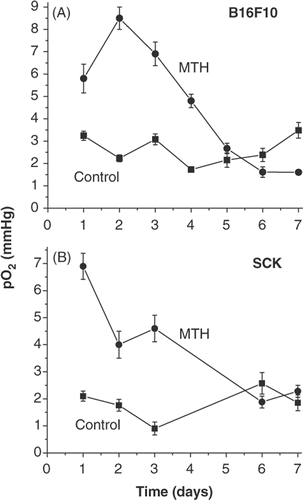
Figure 1. Tumour oxygenation as a function of daily fractionated mild temperature hyperthermia (41.5°C, 60 min). Tumour oxygenation is transiently increased by fractionated mild temperature hyperthermia (MTH) treatment in B16F10 and SCK tumors as measured in real time by Eppendorf histograph. -▪- control and -•- 41.5°C (60 min) heatings.

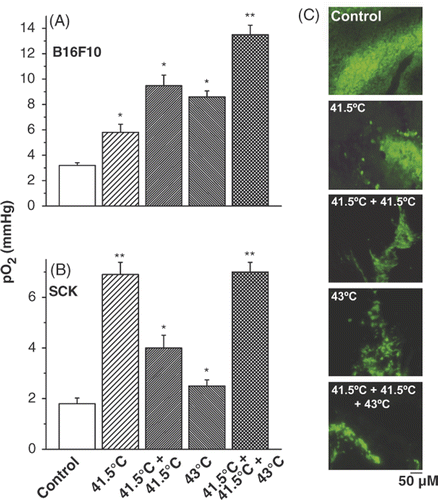
Figure 2. Vascular thermal tolerance. Pre-treatment of tumours with mild temperature hyperthermia (41.5°C, 60 min) increases tumour oxygenation by conventional hyperthermia (43°C, 60 min) treatment in B16F10 (A) and SCK (B) tumours. Representative pimonidazole stainings of control, and different hyperthermia schedules in B16F10 tumours (C). A minimum of 3 tumours and 10 randomly chosen images per treatment group were acquired. Original magnification, ×200; Scale bar 50 µM. *p < 0.05 versus control; **p < 0.05 versus 43°C treatment group.

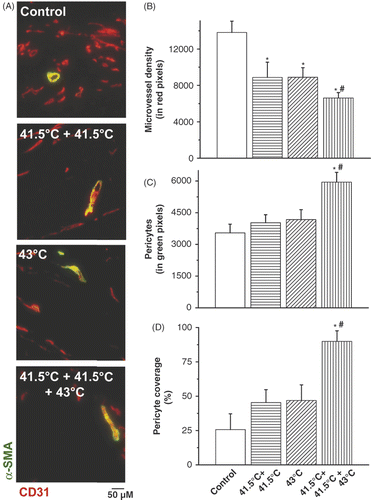
Figure 3. Histological analysis of pericytes and microvessel density (MVD) after hyperthermia treatment schedules. Co-localisation staining of pericytes (α-SMA, green) and microvessel density (CD31, red) in B16F10 tumours (A). Quantification of IF staining for microvessel density (CD31) (B), pericytes (α-SMA) (C) and pericyte covered vessels (D) by morphometric analysis. Original magnification, ×200; scale bar 50 µM. *p < 0.05 versus control; *#p < 0.05 versus 43°C treatment group. After binarisation of the images, microvessel density or pericytes were estimated by scoring the total number of representative coloured pixels per field. A pericyte-covered tumour blood vessel is considered a mature, normalised vessel.

Figure 4. Fractionated radiation treatment enhancement by rational scheduling of mild temperature hyperthermia. B16F10 tumour volumes after hyperthermia, radiation or combination treatments (A). Tumour-bearing animals were treated with control (-▪-), heat (-▾-, 41.5°C 60 min on days 7 and 8; indicated by arrowhead), radiation (-▴-, 5 Gy, day 8 and 9, indicated by diamond arrow tail), or combined (-♦-). Data are plotted as means ± SEM over time with third order polynomial line fitting. Efficacy determination of combination therapy of heat and fractionated radiation (B). The following formula was applied to determine efficacy Citation[21]: the expected tumour growth inhibition from combination treatment (tumour growth inhibition by hyperthermia × tumour growth inhibition by radiation) / observed tumour growth inhibition. A ratio >1 indicates a synergistic (greater than additive) effect.
![Figure 4. Fractionated radiation treatment enhancement by rational scheduling of mild temperature hyperthermia. B16F10 tumour volumes after hyperthermia, radiation or combination treatments (A). Tumour-bearing animals were treated with control (-▪-), heat (-▾-, 41.5°C 60 min on days 7 and 8; indicated by arrowhead), radiation (-▴-, 5 Gy, day 8 and 9, indicated by diamond arrow tail), or combined (-♦-). Data are plotted as means ± SEM over time with third order polynomial line fitting. Efficacy determination of combination therapy of heat and fractionated radiation (B). The following formula was applied to determine efficacy Citation[21]: the expected tumour growth inhibition from combination treatment (tumour growth inhibition by hyperthermia × tumour growth inhibition by radiation) / observed tumour growth inhibition. A ratio >1 indicates a synergistic (greater than additive) effect.](/cms/asset/73337dc7-2028-4366-a0c6-ea10039d460f/ihyt_a_510495_f0004_b.gif)
Figure 5. Clonogenic potential of parenchymal and stromal cells after different hyperthermia schedules. Survival of B16F10 (A), HUVEC (B), fibroblasts (C), and 10T½ pericyte cells (D), after different hyperthermia treatments as indicated. Acquisition of thermotolerance (E). Treatment schedules were as follows: (1) mild temperature hyperthermia (MTH), where the flasks were heated at 41.5°C for 60 min two consecutive days in a row, day 1 and 2; (2) a single treatment of 43°C for 60 min on the third day of heat treatments; (3) pretreatment of MTH followed by treatment with 43°C for 60 min on day 3. Thermal tolerance was determined by the following formula Citation[21]: the observed fraction of colony formation after MTH pretreatment/the expected fraction of colony formation (i.e. fraction of colonies after MTH × fraction of colonies after 43°C for 60 min). A ratio >1 indicates induced thermal tolerance by MTH pretreatment, whereas a ratio of <1 indicates an induction of thermal sensitisation by MTH pretreatment.
![Figure 5. Clonogenic potential of parenchymal and stromal cells after different hyperthermia schedules. Survival of B16F10 (A), HUVEC (B), fibroblasts (C), and 10T½ pericyte cells (D), after different hyperthermia treatments as indicated. Acquisition of thermotolerance (E). Treatment schedules were as follows: (1) mild temperature hyperthermia (MTH), where the flasks were heated at 41.5°C for 60 min two consecutive days in a row, day 1 and 2; (2) a single treatment of 43°C for 60 min on the third day of heat treatments; (3) pretreatment of MTH followed by treatment with 43°C for 60 min on day 3. Thermal tolerance was determined by the following formula Citation[21]: the observed fraction of colony formation after MTH pretreatment/the expected fraction of colony formation (i.e. fraction of colonies after MTH × fraction of colonies after 43°C for 60 min). A ratio >1 indicates induced thermal tolerance by MTH pretreatment, whereas a ratio of <1 indicates an induction of thermal sensitisation by MTH pretreatment.](/cms/asset/46bb9a10-f05f-411c-97ae-0229cd68627d/ihyt_a_510495_f0005_b.gif)