1,030
Views
34
CrossRef citations to date
0
Altmetric
RESEARCH ARTICLE

The effect of magnetic nanoparticle dispersion on temperature distribution in a spherical tissue in magnetic fluid hyperthermia using the lattice Boltzmann method

&
Pages 266-274 | Received 24 Apr 2010, Accepted 25 Aug 2010, Published online: 18 Apr 2011

Figures & data

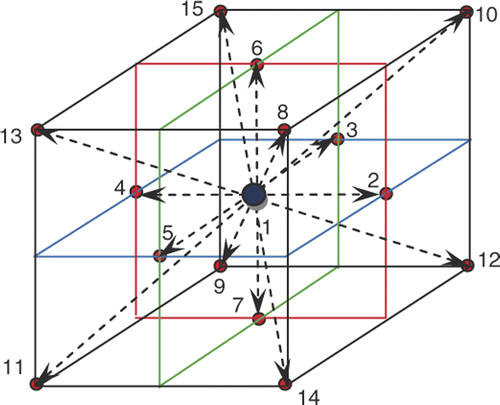
Figure 1. Schematic plot of the D3Q15 lattice.

Figure 1. Schematic plot of the D3Q15 lattice.

Figure 2. Curved boundary and lattice nodes (open large circle is computational boundary node, open small circle is media node, filled circle is the physical boundary node in the link of media node and computational boundary).
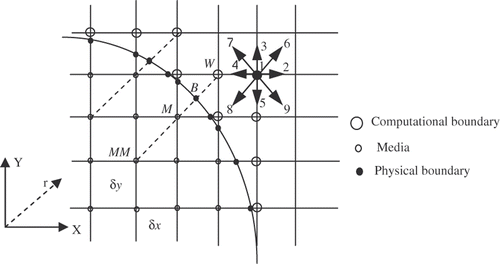
Figure 2. Curved boundary and lattice nodes (open large circle is computational boundary node, open small circle is media node, filled circle is the physical boundary node in the link of media node and computational boundary).

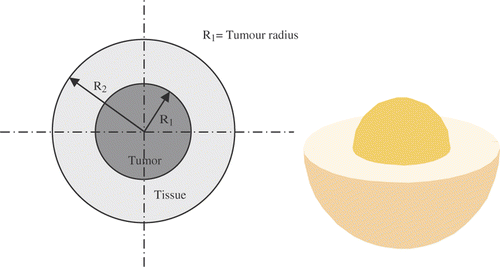
Figure 3. Schematic plot of tissue and tumour. Left, section; right, perspective.

Figure 3. Schematic plot of tissue and tumour. Left, section; right, perspective.

Table 1.  Properties of the tissue, the blood, the FCC FePt MNPs and the magnetic field.

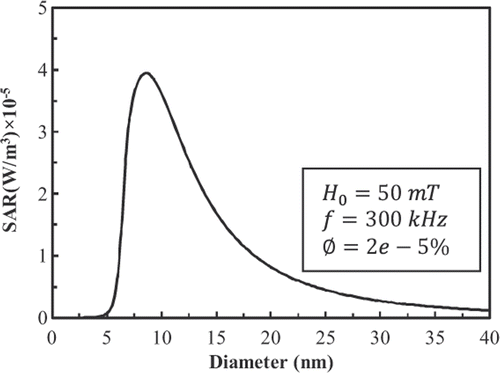
Figure 4. Effect of particle diameter on power dissipation of FCC FePt MNPs.

Figure 4. Effect of particle diameter on power dissipation of FCC FePt MNPs.

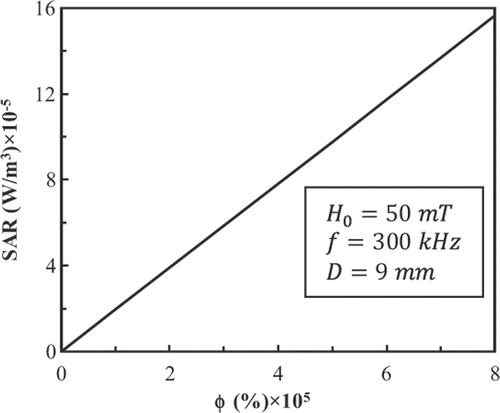
Figure 5. Effect of volume fraction on power dissipation of 9-nm FCC FePt MNPs.

Figure 5. Effect of volume fraction on power dissipation of 9-nm FCC FePt MNPs.

Figure 6. Steady state temperature distribution in the infinite spherical tissue for where B = 800 k W/m3 and r0 = 5 mm.
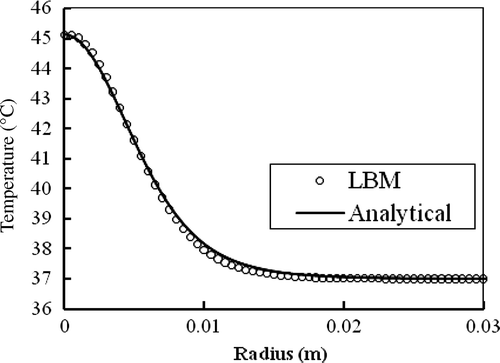
Figure 6. Steady state temperature distribution in the infinite spherical tissue for where B = 800 k W/m3 and r0 = 5 mm.

Figure 7. Temperature elevation in the injection site in agarose gel for a gel concentration of 0.2% and an infusion flow rate 4 µl/min for SAR(r) = Ber2/r20 where B = 887.8 k W/m3 and r0 = 5.62 mm.

Figure 7. Temperature elevation in the injection site in agarose gel for a gel concentration of 0.2% and an infusion flow rate 4 µl/min for SAR(r) = Be−r2/r20 where B = 887.8 k W/m3 and r0 = 5.62 mm.
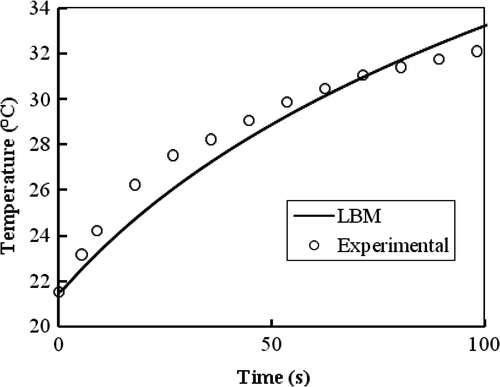
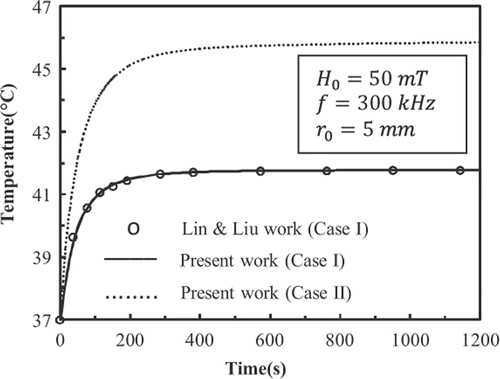
Figure 8. History of temperature at the centre of the tumour deposited with 9-nm FCC FePt MNPs.

Figure 8. History of temperature at the centre of the tumour deposited with 9-nm FCC FePt MNPs.

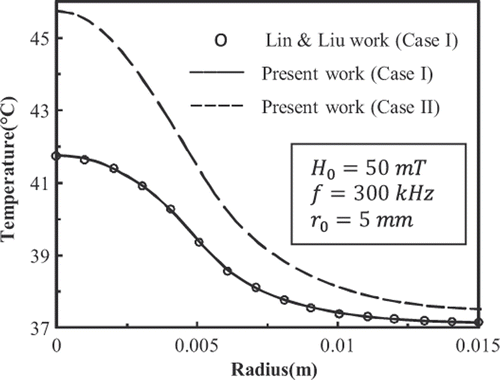
Figure 9. Temperature distributions in the tissue deposited with 9-nm FCC FePt MNPs at t = 600 s.

Figure 9. Temperature distributions in the tissue deposited with 9-nm FCC FePt MNPs at t = 600 s.

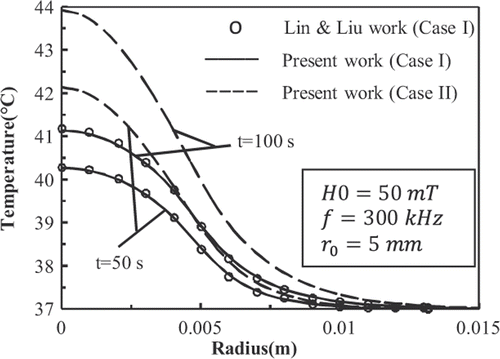
Figure 10. Temperature distributions in the tissue deposited with 9-nm FCC FePt MNPs at t = 50 s and t = 100 s.

Figure 10. Temperature distributions in the tissue deposited with 9-nm FCC FePt MNPs at t = 50 s and t = 100 s.

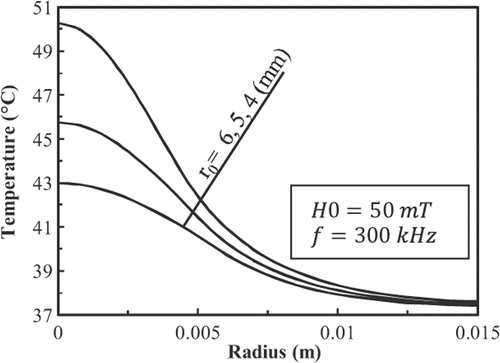
Figure 11. Temperature distributions in the tissue deposited with 9-nm FCC FePt MNPs at t = 600 s in case II as a function of r0.

Figure 11. Temperature distributions in the tissue deposited with 9-nm FCC FePt MNPs at t = 600 s in case II as a function of r0.

Reprints and Corporate Permissions

Please note: Selecting permissions does not provide access to the full text of the article, please see our help page How do I view content?

To request a reprint or corporate permissions for this article, please click on the relevant link below:

Academic Permissions

Please note: Selecting permissions does not provide access to the full text of the article, please see our help page How do I view content?

Obtain permissions instantly via Rightslink by clicking on the button below:

If you are unable to obtain permissions via Rightslink, please complete and submit this Permissions form. For more information, please visit our Permissions help page.