425
Views
24
CrossRef citations to date
0
Altmetric
RESEARCH ARTICLE

3D versus 2D steering in patient anatomies: A comparison using hyperthermia treatment planning

, , &
Pages 74-85 | Received 29 Mar 2010, Accepted 11 Oct 2010, Published online: 04 Jan 2011

Figures & data

Figure 1. The AMC-8 phased-array 70 MHz waveguide system. The system consists of two rings of four waveguides. Every waveguide has a separate water bolus that provides superficial cooling of the patient and coupling of the incident electromagnetic field into the patient. The two bottom waveguides share the same water bolus. The distance between the two rings is adjustable.
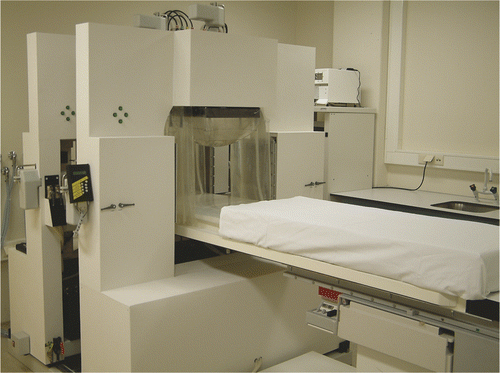
Figure 1. The AMC-8 phased-array 70 MHz waveguide system. The system consists of two rings of four waveguides. Every waveguide has a separate water bolus that provides superficial cooling of the patient and coupling of the incident electromagnetic field into the patient. The two bottom waveguides share the same water bolus. The distance between the two rings is adjustable.

Table I.  Tissue properties in the electromagnetic and thermal simulations.

Table II.  Overview of patient characteristics for the selected patients.

Figure 2. Coronal cross-section of the waveguide configuration of the AMC-4 (left) and AMC-8 (right) phased-array system and the water boluses. Waveguide aperture size equals 20.2 × 34.3 cm2. The distance between the two rings of the AMC-8 system (ring-to-ring distance (RRD)) can be varied and by default in this study is 1.5 cm.
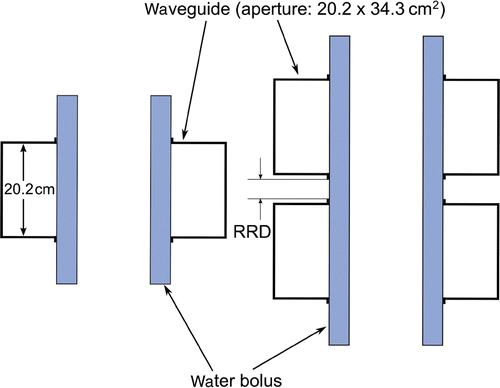
Figure 2. Coronal cross-section of the waveguide configuration of the AMC-4 (left) and AMC-8 (right) phased-array system and the water boluses. Waveguide aperture size equals 20.2 × 34.3 cm2. The distance between the two rings of the AMC-8 system (ring-to-ring distance (RRD)) can be varied and by default in this study is 1.5 cm.

Figure 3. The normalised ratio of target- and normal tissue SAR for the AMC-4 and the AMC-8 system for different axial positions after optimisation for patients 1 to 5. The SAR ratios are normalised by the SAR ratio found for the AMC-4 system under optimal positioning. Antennas were not allowed to contribute more to the total delivered power than 40%, or less than 10% for the AMC-4 system, and no more than 25% or less than 5% for the AMC-8 system.
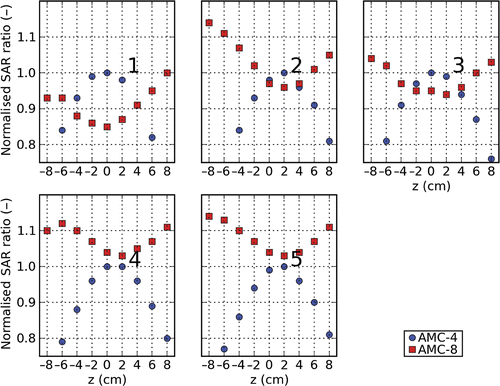
Figure 3. The normalised ratio of target- and normal tissue SAR for the AMC-4 and the AMC-8 system for different axial positions after optimisation for patients 1 to 5. The SAR ratios are normalised by the SAR ratio found for the AMC-4 system under optimal positioning. Antennas were not allowed to contribute more to the total delivered power than 40%, or less than 10% for the AMC-4 system, and no more than 25% or less than 5% for the AMC-8 system.

Figure 4. The temperature gain for T10, T50 and T90 when moving from the AMC-4 to the AMC-8 system for patients 1 to 5. The applied settings resulted from temperature-based optimisation. For the AMC-8 system a 1.5-cm ring-to-ring distance was applied.
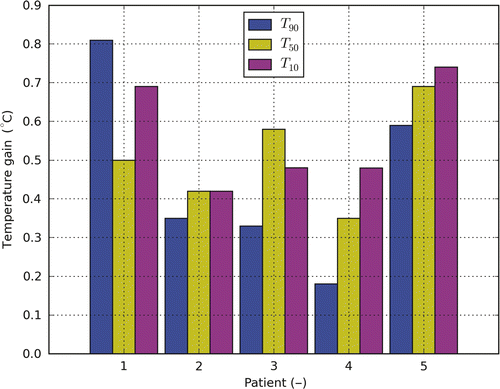
Figure 4. The temperature gain for T10, T50 and T90 when moving from the AMC-4 to the AMC-8 system for patients 1 to 5. The applied settings resulted from temperature-based optimisation. For the AMC-8 system a 1.5-cm ring-to-ring distance was applied.
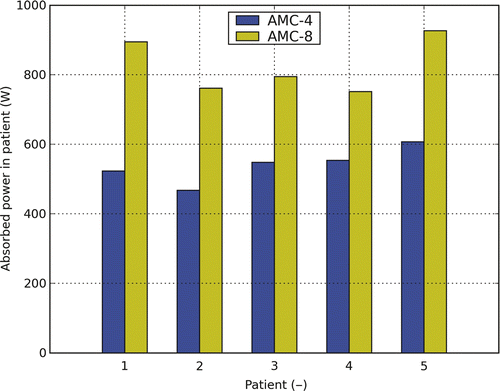
Figure 5. Total absorbed power for the AMC-4 and the AMC-8 system for patients 1 to 5. The applied settings result from temperature-based optimisation. For the AMC-8 system a 1.5-cm ring-to-ring distance was applied.

Figure 5. Total absorbed power for the AMC-4 and the AMC-8 system for patients 1 to 5. The applied settings result from temperature-based optimisation. For the AMC-8 system a 1.5-cm ring-to-ring distance was applied.

Figure 6. Cumulative temperature−volume histograms of the temperature distribution resulting from temperature-based optimisation for the five patients. The inserts zoom in to the 43−45°C range of the histogram. Indicated in the lower left corner of each plot is the patient number.
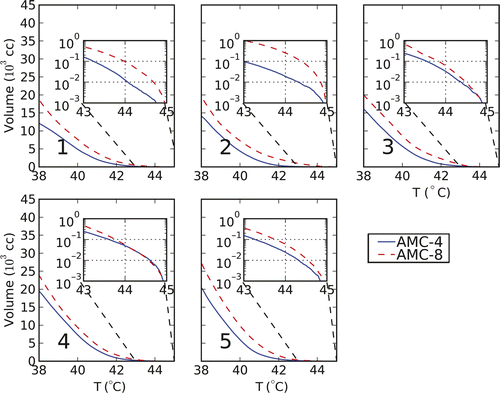
Figure 6. Cumulative temperature−volume histograms of the temperature distribution resulting from temperature-based optimisation for the five patients. The inserts zoom in to the 43−45°C range of the histogram. Indicated in the lower left corner of each plot is the patient number.

Figure 7. An example of the resulting temperature distribution (right) after temperature-based optimisation with the corresponding coronal slices (left) for the AMC-4 system (top) and the AMC-8 system (bottom).
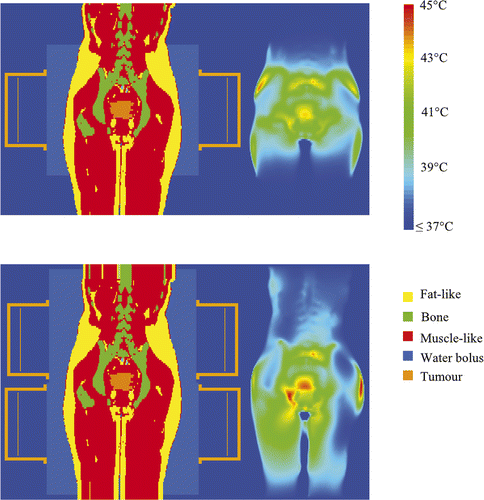
Figure 7. An example of the resulting temperature distribution (right) after temperature-based optimisation with the corresponding coronal slices (left) for the AMC-4 system (top) and the AMC-8 system (bottom).

Figure 8. T90 and T50 for different axial shifts (z-axis) of patients 1 to 5. For every shift the T90 and T50 were evaluated for two sets of amplitudes and phases. The first is the result of optimisation with the patient modelled at the correct/actual position (unconnected markers). The second results from optimisation without shifting the patient (connected markers). The figure shows that the AMC-8 system has the capability of correcting for changes in the axial position of the patient, contrary to the AMC-4 system.
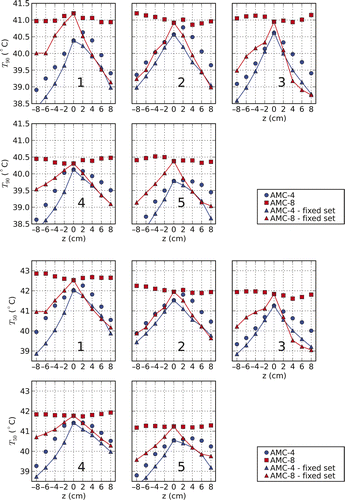
Figure 8. T90 and T50 for different axial shifts (z-axis) of patients 1 to 5. For every shift the T90 and T50 were evaluated for two sets of amplitudes and phases. The first is the result of optimisation with the patient modelled at the correct/actual position (unconnected markers). The second results from optimisation without shifting the patient (connected markers). The figure shows that the AMC-8 system has the capability of correcting for changes in the axial position of the patient, contrary to the AMC-4 system.

Figure 9. Differences in T90 after temperature optimisation for the AMC-8 system using varying ring-to-ring distances. Results are relative to the results for a ring-to-ring distance of 1.5 cm. The figure on the left shows the change in T90 applying optimised settings for a 1.5 cm ring-to-ring distance at larger distances without adjustment of settings. The figure on the right shows the T90 optimising for the actual distances relative to the optimal T90 for a ring-to-ring distance of 1.5 cm.
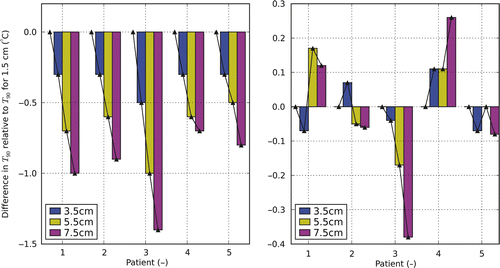
Figure 9. Differences in T90 after temperature optimisation for the AMC-8 system using varying ring-to-ring distances. Results are relative to the results for a ring-to-ring distance of 1.5 cm. The figure on the left shows the change in T90 applying optimised settings for a 1.5 cm ring-to-ring distance at larger distances without adjustment of settings. The figure on the right shows the T90 optimising for the actual distances relative to the optimal T90 for a ring-to-ring distance of 1.5 cm.

Reprints and Corporate Permissions

Please note: Selecting permissions does not provide access to the full text of the article, please see our help page How do I view content?

To request a reprint or corporate permissions for this article, please click on the relevant link below:

Academic Permissions

Please note: Selecting permissions does not provide access to the full text of the article, please see our help page How do I view content?

Obtain permissions instantly via Rightslink by clicking on the button below:

If you are unable to obtain permissions via Rightslink, please complete and submit this Permissions form. For more information, please visit our Permissions help page.