Figures & data
Figure 1. Electrolyte leakage from transiently heated erythrocytes as evidenced by the temperature dependence of suspension conductivity, σs, and of its temperature derivative, ∂σs/∂θ. The suspension medium was a low-salt isotonic solution of 50 mM NaCl and 200 mOsm sucrose. Haematocrit, frequency and the heating rate were 0.25, 10 kHz, and 4°C/min, respectively. Arrow indicates the mid-point inducing temperature, Tm, for the ion leakage at this heating rate. Tonset and Tend indicate the onset and end of the electrolyte leakage. Tm represents the thermal stability of erythrocyte membrane. Dotted line indicates the Boltzman-type temperature dependence of σs.
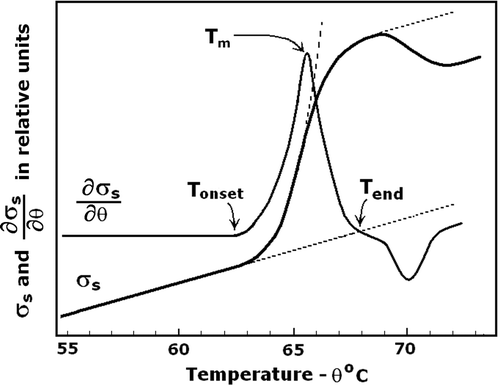
Figure 2. Ion leakage at the presence of various osmotic protectors. The erythrocyte suspension medium was an isotonic solution that contained 50 mM NaCl and 200 mOsm of the applied osmolyte; sorbitol, sucrose and raffinose. Positive peak depicts the ion leakage, the consequent negative peak corresponds to the inward diffusion of the osmolyte. The other details are as for .
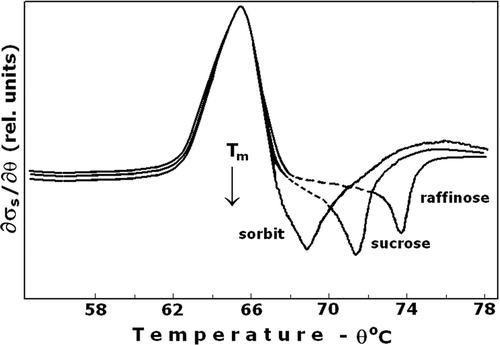
Figure 3. Effect of DIDS on the ion leakage and thermal stability of erythrocyte membrane, Tm. The erythrocytes were treated at optimal conditions (100 mM NaCl, 10 mM Tris buffer, pH 8.2, 2 mM EDTA, and 100 mM sucrose, haematocrit 0.015, 4°C for 10 min) with 15 µM DIDS (curve 1) and without DIDS (curve C – control). The curve 2 represents irregular pattern of ion leakage due to DIDS binding at non-optimal conditions. The other details are as for . Number of experiments, N = 10, a typical one is shown.
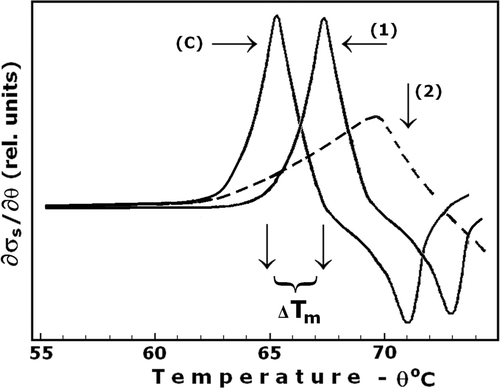
Table I. Membrane thermostability and resistance against thermal haemolysis of control and DIDS-treated erythrocytes. The erythrocytes were treated at optimal conditions (100 mM NaCl, 10 mM Tris buffer, pH 8.2, 2 mM EDTA, and 100 mM sucrose, haematocrit 0.015, 4°C for 10 min). The thermal resistance is defined by the time, t1/2, of exposure to 53°C resulting in 50% haemolysis. Membrane thermostability is defined by the temperature, Tm, that induces electrolyte leakage during heating of erythrocytes with low rate (0.5°C/min).
Figure 4. Effect of DIDS on the resistance of erythrocytes against thermal haemolysis, t1/2. Cells treated with DIDS (•) or without DIDS (○) at optimal conditions (see for details) were exposed to 53°C for the indicated time intervals. The extent of haemolysis was determined by the optical density of the suspension at 700 nm (E700), normalized to its initial value. The initial and final values of E700 corresponded to 0% and 100% haemolysis, respectively. The t1/2 indicated the time for 50% haemolysis. Number of experiments, N = 4, a typical one is shown.
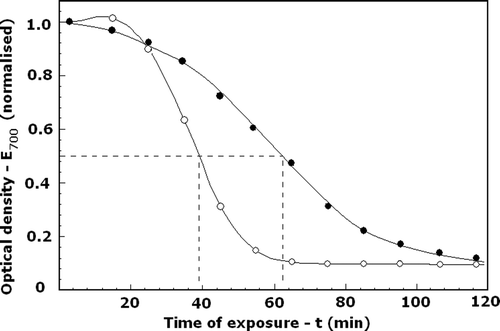
Figure 5. Effect of step-wise increase in the temperature on the excimerisation coefficient of N-(3-pyrenyl)maleimide bound to intact (A) and DIDS-treated isolated EM (B). Fluorescence was excited at 350 nm and detected at 402 nm with intensity Im for monomeric and at 421 nm with intensity Ie for excimeric emission, respectively. Excimerisation coefficient was calculated as the ratio of Ie/Im. The final concentrations of EM and N-(3-pyrenyl)maleimide were 0.3 mg protein/mL and 1.5 µg/mL, respectively. The EMs were exposed for 4.5 min at each indicated temperature. Arrows indicate the inducing temperature for the ion leakage, Tm, the spectrin denaturation temperature, TA Citation[11], and the denaturation temperature, Td Citation[12], Citation[17], of the MDB3 at low (0.5°C/min) heating rate.
![Figure 5. Effect of step-wise increase in the temperature on the excimerisation coefficient of N-(3-pyrenyl)maleimide bound to intact (A) and DIDS-treated isolated EM (B). Fluorescence was excited at 350 nm and detected at 402 nm with intensity Im for monomeric and at 421 nm with intensity Ie for excimeric emission, respectively. Excimerisation coefficient was calculated as the ratio of Ie/Im. The final concentrations of EM and N-(3-pyrenyl)maleimide were 0.3 mg protein/mL and 1.5 µg/mL, respectively. The EMs were exposed for 4.5 min at each indicated temperature. Arrows indicate the inducing temperature for the ion leakage, Tm, the spectrin denaturation temperature, TA Citation[11], and the denaturation temperature, Td Citation[12], Citation[17], of the MDB3 at low (0.5°C/min) heating rate.](/cms/asset/65fab127-93a4-40ff-8bb6-cc745ed0d231/ihyt_a_554064_f0005_b.gif)
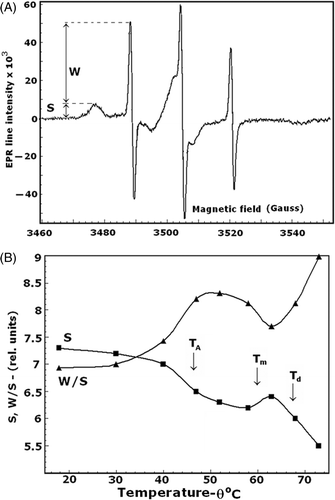
Figure 6. EPR spectrum of isolated EMs spin labeled with 3-maleimido-proxyl (panel A). S and W are the amplitudes of the EPR signals, corresponding to the number of strongly immobilised and weakly immobilised spin labels, respectively, covalently bound to the major EM proteins. The temperature dependences of the S and W/S spectral parameters are shown in panel B. Arrows indicate the temperatures as explained for .
