637
Views
12
CrossRef citations to date
0
Altmetric
RESEARCH ARTICLE

The electrical conductivity of in vivo human uterine fibroids

, & , PhD
Pages 255-265 | Received 19 Oct 2010, Accepted 15 Jan 2011, Published online: 18 Apr 2011

Figures & data

Figure 1. RF Ablation System.

Figure 1. RF Ablation System.

Figure 2. Applicator Detail.

Figure 2. Applicator Detail.

Table I.  Human uterus.

Table II.  Catheter (PEEK – Victrex 381 G).

Table III.  Trocar (304 Stainless Steel).

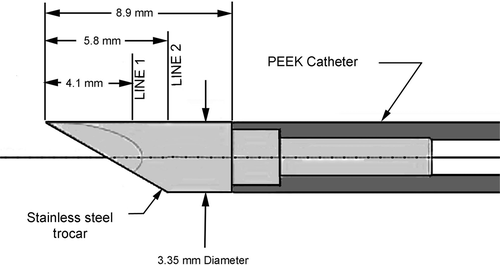
Figure 3. Side view of trocar showing line locations for tissue temperature profiles.

Figure 3. Side view of trocar showing line locations for tissue temperature profiles.

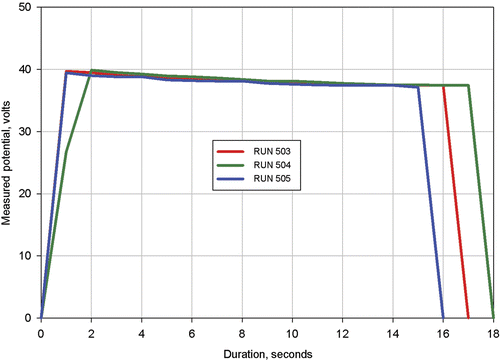
Figure 4. Measured applied voltage for Procedures 503, 504, and 505.

Figure 4. Measured applied voltage for Procedures 503, 504, and 505.

Figure 5. Side view of trocarshowing mesh for a simulation utilizing approximately 100,000 elements.
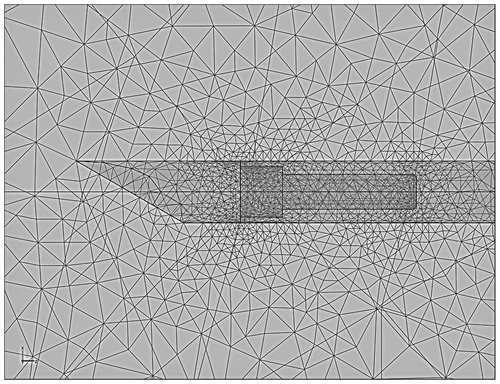
Figure 5. Side view of trocarshowing mesh for a simulation utilizing approximately 100,000 elements.

Figure 6. Results from simulation of Clinical Ablation 503 showing measured power dissipation and computed power dissipation with a 37°C tissue electrical conductivity of 0.305 S/m and a tissue electrical conductivity temperature coefficient of 0.2%/°C. Electrodes completely retracted.
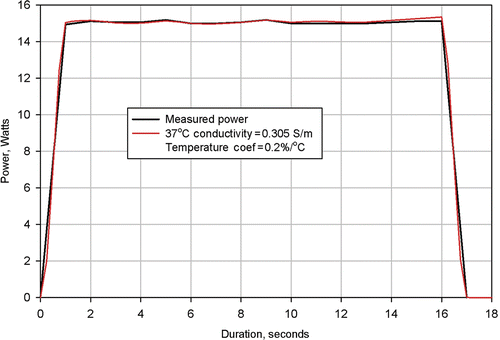
Figure 6. Results from simulation of Clinical Ablation 503 showing measured power dissipation and computed power dissipation with a 37°C tissue electrical conductivity of 0.305 S/m and a tissue electrical conductivity temperature coefficient of 0.2%/°C. Electrodes completely retracted.
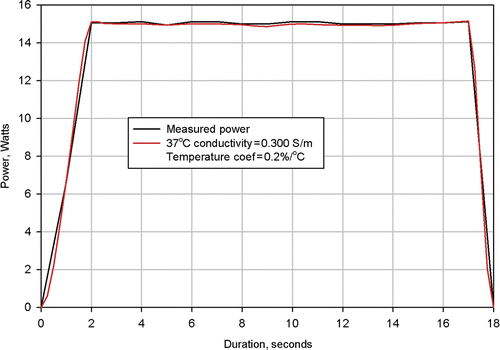
Figure 7. Results from simulation of Clinical Ablation 504 showing measured power dissipation and computed power dissipation with a 37°C tissue electrical conductivity of 0.300 S/m and a tissue electrical conductivity temperature coefficient of 0.2%/°C. Electrodes completely retracted.
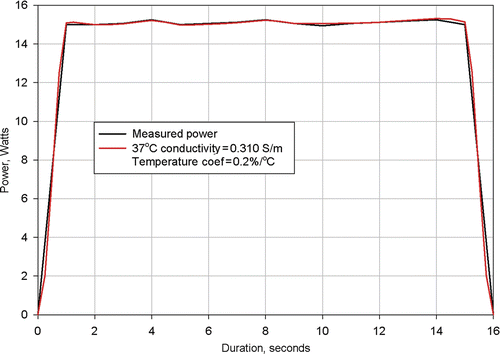
Figure 7. Results from simulation of Clinical Ablation 504 showing measured power dissipation and computed power dissipation with a 37°C tissue electrical conductivity of 0.300 S/m and a tissue electrical conductivity temperature coefficient of 0.2%/°C. Electrodes completely retracted.

Figure 8. Results from simulation of Clinical Ablation 505 showing measured power dissipation and computed power dissipation with a 37°C tissue electrical conductivity of 0.310 S/m and a tissue electrical conductivity temperature coefficient of 0.2%/°C. Electrodes completely retracted.

Figure 8. Results from simulation of Clinical Ablation 505 showing measured power dissipation and computed power dissipation with a 37°C tissue electrical conductivity of 0.310 S/m and a tissue electrical conductivity temperature coefficient of 0.2%/°C. Electrodes completely retracted.

Figure 9. Results from simulation of Clinical Ablation 504 showing measured power dissipation and computed power dissipation with a 37°C tissue electrical conductivity of 0.300 S/m and a tissue electrical conductivity temperature coefficient of 0.2%/°C (baseline conditions). Electrodes completely retracted. Four additional simulations shown with tissue thermal conductivity increased by 20%, tissue heat capacity increased by 20%, trocar thermal capacity increased by 5%, and perfusion coefficient changed from 0 to 6.4e-3 1/s.
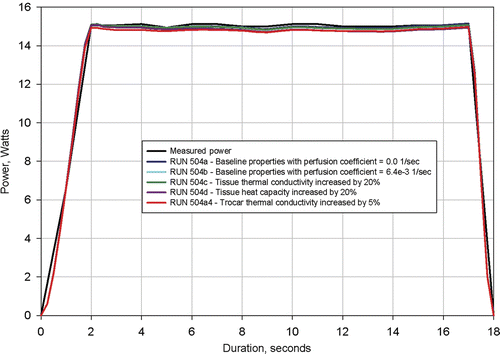
Figure 9. Results from simulation of Clinical Ablation 504 showing measured power dissipation and computed power dissipation with a 37°C tissue electrical conductivity of 0.300 S/m and a tissue electrical conductivity temperature coefficient of 0.2%/°C (baseline conditions). Electrodes completely retracted. Four additional simulations shown with tissue thermal conductivity increased by 20%, tissue heat capacity increased by 20%, trocar thermal capacity increased by 5%, and perfusion coefficient changed from 0 to 6.4e-3 1/s.

Figure 10. Results from simulation of Clinical Ablation 504 showing measured power dissipation and computed power dissipation with a 37°C tissue electrical conductivity of 0.300 S/m and a tissue electrical conductivity temperature coefficient of 0.2%/°C (baseline conditions). Electrodes completely retracted. Two additional simulations shown with tissue electrical conductivity at 37°C increased by 20% and tissue electrical conductivity temperature coefficient reduced by 50%.
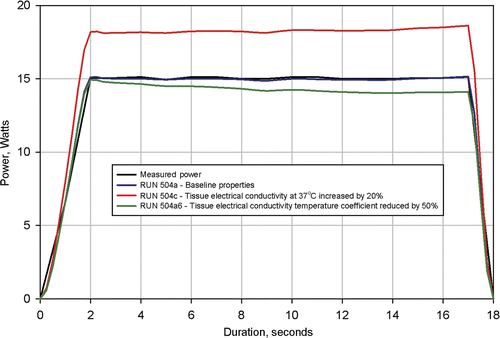
Figure 10. Results from simulation of Clinical Ablation 504 showing measured power dissipation and computed power dissipation with a 37°C tissue electrical conductivity of 0.300 S/m and a tissue electrical conductivity temperature coefficient of 0.2%/°C (baseline conditions). Electrodes completely retracted. Two additional simulations shown with tissue electrical conductivity at 37°C increased by 20% and tissue electrical conductivity temperature coefficient reduced by 50%.

Figure 11. Computed tissue temperatures outward on a radius from the trocar surface at a distance of 4.1 mm from the trocar tip. The temperature profiles are shown at durations of 8 seconds, 12 seconds, and 16 seconds. Profiles are shown with the nominal value for tissue thermal conductivity and the nominal value increased by 20%.
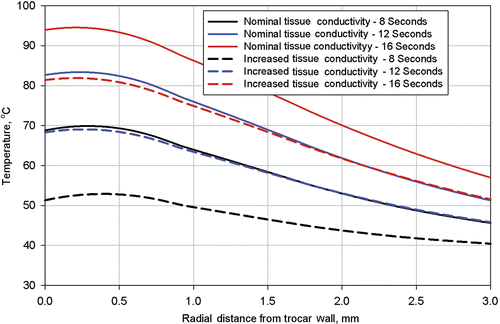
Figure 11. Computed tissue temperatures outward on a radius from the trocar surface at a distance of 4.1 mm from the trocar tip. The temperature profiles are shown at durations of 8 seconds, 12 seconds, and 16 seconds. Profiles are shown with the nominal value for tissue thermal conductivity and the nominal value increased by 20%.
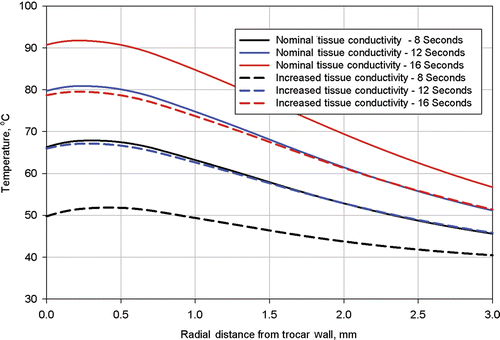
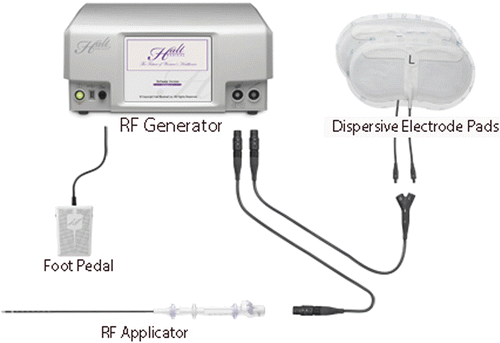
Figure 12. Computed tissue temperatures outward on a radius from the trocar surface at a distance of 5.8 mm from the trocar tip. The temperature profiles are shown at durations of 8 seconds, 12 seconds, and 16 seconds. Profiles are shown with the nominal value for tissue thermal conductivity and the nominal value increased by 20%.
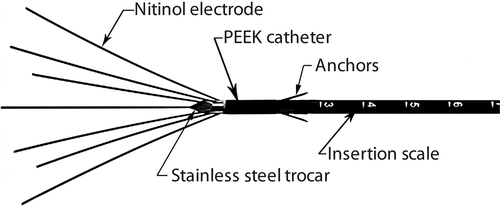
Figure 12. Computed tissue temperatures outward on a radius from the trocar surface at a distance of 5.8 mm from the trocar tip. The temperature profiles are shown at durations of 8 seconds, 12 seconds, and 16 seconds. Profiles are shown with the nominal value for tissue thermal conductivity and the nominal value increased by 20%.
Reprints and Corporate Permissions

Please note: Selecting permissions does not provide access to the full text of the article, please see our help page How do I view content?

To request a reprint or corporate permissions for this article, please click on the relevant link below:

Academic Permissions

Please note: Selecting permissions does not provide access to the full text of the article, please see our help page How do I view content?

Obtain permissions instantly via Rightslink by clicking on the button below:

If you are unable to obtain permissions via Rightslink, please complete and submit this Permissions form. For more information, please visit our Permissions help page.