1,414
Views
43
CrossRef citations to date
0
Altmetric
Research Article

Induction of a tumour-specific CTL response by exosomes isolated from heat-treated malignant ascites of gastric cancer patients

, , , , , & show all
Pages 604-611 | Received 20 Jun 2010, Accepted 16 Feb 2011, Published online: 16 Aug 2011

Figures & data

Table I.  Patient characteristics.

Figure 1. Identification of exosomes. A representative image from one sample (patient 1) of electron microscopy performed on exosome preparations showing bilayer membranes that range in size from 40–90 nm. Bar = 100 nm.
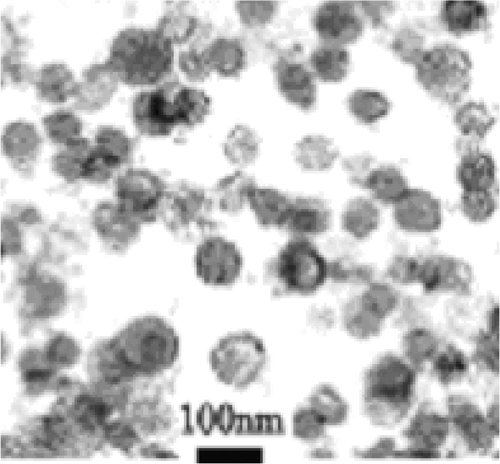
Figure 1. Identification of exosomes. A representative image from one sample (patient 1) of electron microscopy performed on exosome preparations showing bilayer membranes that range in size from 40–90 nm. Bar = 100 nm.

Figure 2. Western blot analysis of exosome preparations and cell lysate before and after heat treatment. Cell lysate and exosome samples with and without heat treatment (HS) were prepared as described in the Materials and methods. The primary antibodies used for detection are indicated in the figure, with detection of actin used as a loading control. Data from a representative sample (from patient 7) is shown.
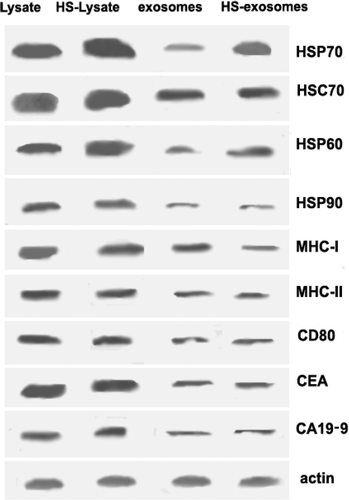
Figure 2. Western blot analysis of exosome preparations and cell lysate before and after heat treatment. Cell lysate and exosome samples with and without heat treatment (HS) were prepared as described in the Materials and methods. The primary antibodies used for detection are indicated in the figure, with detection of actin used as a loading control. Data from a representative sample (from patient 7) is shown.

Figure 3. Characterisation of DC phenotype. Immature DCs pulsed with HS-exosomes, untreated exosomes, HS-lysate, or LPS were stained with antibodies recognising MHC-II, CD86, CD40, or CD80, and analysed by flow cytometry. Positive control (LPS) for DC maturation was used. The dashed line represents the isotype control, the fine black line represents exosomes, the bold black line represents HS-exosomes, the red thin line represents HS-lysate, and the green thin line represents LPS. Data from a representative sample (from patient 14) is shown.
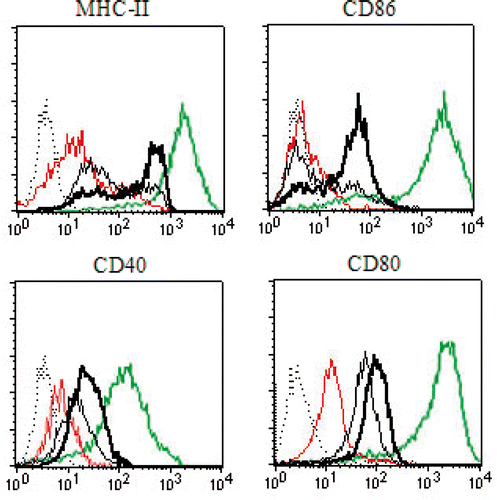
Figure 3. Characterisation of DC phenotype. Immature DCs pulsed with HS-exosomes, untreated exosomes, HS-lysate, or LPS were stained with antibodies recognising MHC-II, CD86, CD40, or CD80, and analysed by flow cytometry. Positive control (LPS) for DC maturation was used. The dashed line represents the isotype control, the fine black line represents exosomes, the bold black line represents HS-exosomes, the red thin line represents HS-lysate, and the green thin line represents LPS. Data from a representative sample (from patient 14) is shown.

Figure 4. Cytokine secretion. IL-12p70 (A) and TNF-α (B) levels ± standard deviation (SD) are shown for supernatants of immature DCs pulsed with HS-exosomes or untreated exosomes detected by ELISA. ΔP > 0.05, for the exosome samples versus the PBS samples; ☆P < 0.01, for HS-exosomes versus untreated exosomes or PBS treatment group. Results are presented as the mean levels ± standard deviation (SD) of 18 patient samples.
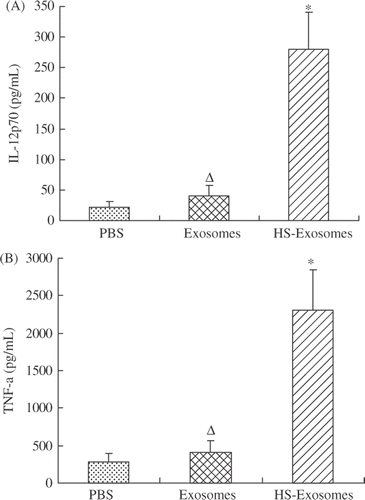
Figure 4. Cytokine secretion. IL-12p70 (A) and TNF-α (B) levels ± standard deviation (SD) are shown for supernatants of immature DCs pulsed with HS-exosomes or untreated exosomes detected by ELISA. ΔP > 0.05, for the exosome samples versus the PBS samples; ☆P < 0.01, for HS-exosomes versus untreated exosomes or PBS treatment group. Results are presented as the mean levels ± standard deviation (SD) of 18 patient samples.

Figure 5. Mixed lymphocyte reaction assays. Proliferation of T cells was assayed in mixed lymphocyte reactions containing various ratios of DCs and T cells as indicated. ΔP > 0.05, for exosomes versus PBS treatment group; ☆P < 0.01, for HS-exosomes versus untreated exosomes or PBS treatment group. Results are presented as the mean proliferation ± standard deviation (SD) of 18 patient samples.
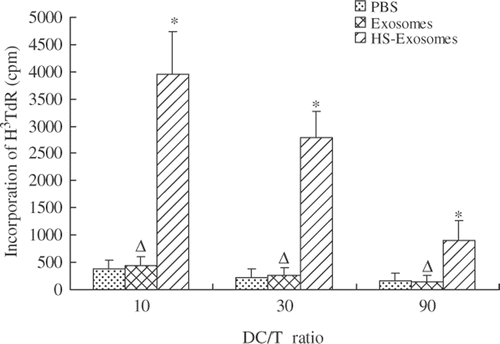
Figure 5. Mixed lymphocyte reaction assays. Proliferation of T cells was assayed in mixed lymphocyte reactions containing various ratios of DCs and T cells as indicated. ΔP > 0.05, for exosomes versus PBS treatment group; ☆P < 0.01, for HS-exosomes versus untreated exosomes or PBS treatment group. Results are presented as the mean proliferation ± standard deviation (SD) of 18 patient samples.

Figure 6. CTL activity assay. Specific cytotoxicity was evaluated in LDH assays containing autologous gastric cancer cells (A) or A549 cells (B) as the target cells. ΔP > 0.05, for the exosome group compared with the PBS group; ☆P < 0.01 for the HS-exosome group compared with the exosome or PBS group; #P > 0.05 for the HS-exosome group compared with the exosome or PBS group. Results are presented as the mean percentage of specific lysis ± standard deviation (SD) of 18 patient samples.
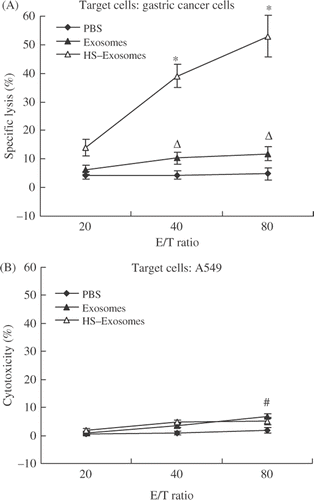
Figure 6. CTL activity assay. Specific cytotoxicity was evaluated in LDH assays containing autologous gastric cancer cells (A) or A549 cells (B) as the target cells. ΔP > 0.05, for the exosome group compared with the PBS group; ☆P < 0.01 for the HS-exosome group compared with the exosome or PBS group; #P > 0.05 for the HS-exosome group compared with the exosome or PBS group. Results are presented as the mean percentage of specific lysis ± standard deviation (SD) of 18 patient samples.

Reprints and Corporate Permissions

Please note: Selecting permissions does not provide access to the full text of the article, please see our help page How do I view content?

To request a reprint or corporate permissions for this article, please click on the relevant link below:

Academic Permissions

Please note: Selecting permissions does not provide access to the full text of the article, please see our help page How do I view content?

Obtain permissions instantly via Rightslink by clicking on the button below:

If you are unable to obtain permissions via Rightslink, please complete and submit this Permissions form. For more information, please visit our Permissions help page.